Inventory Report
Reports → Inventory Report analyzes your stock across three tabs, Overview, Movements and Aged stock. The report is read-only, so nothing you do here changes stock. Overview and Movements cover your whole store, with all locations combined; Aged stock can be narrowed to one location.
Overview
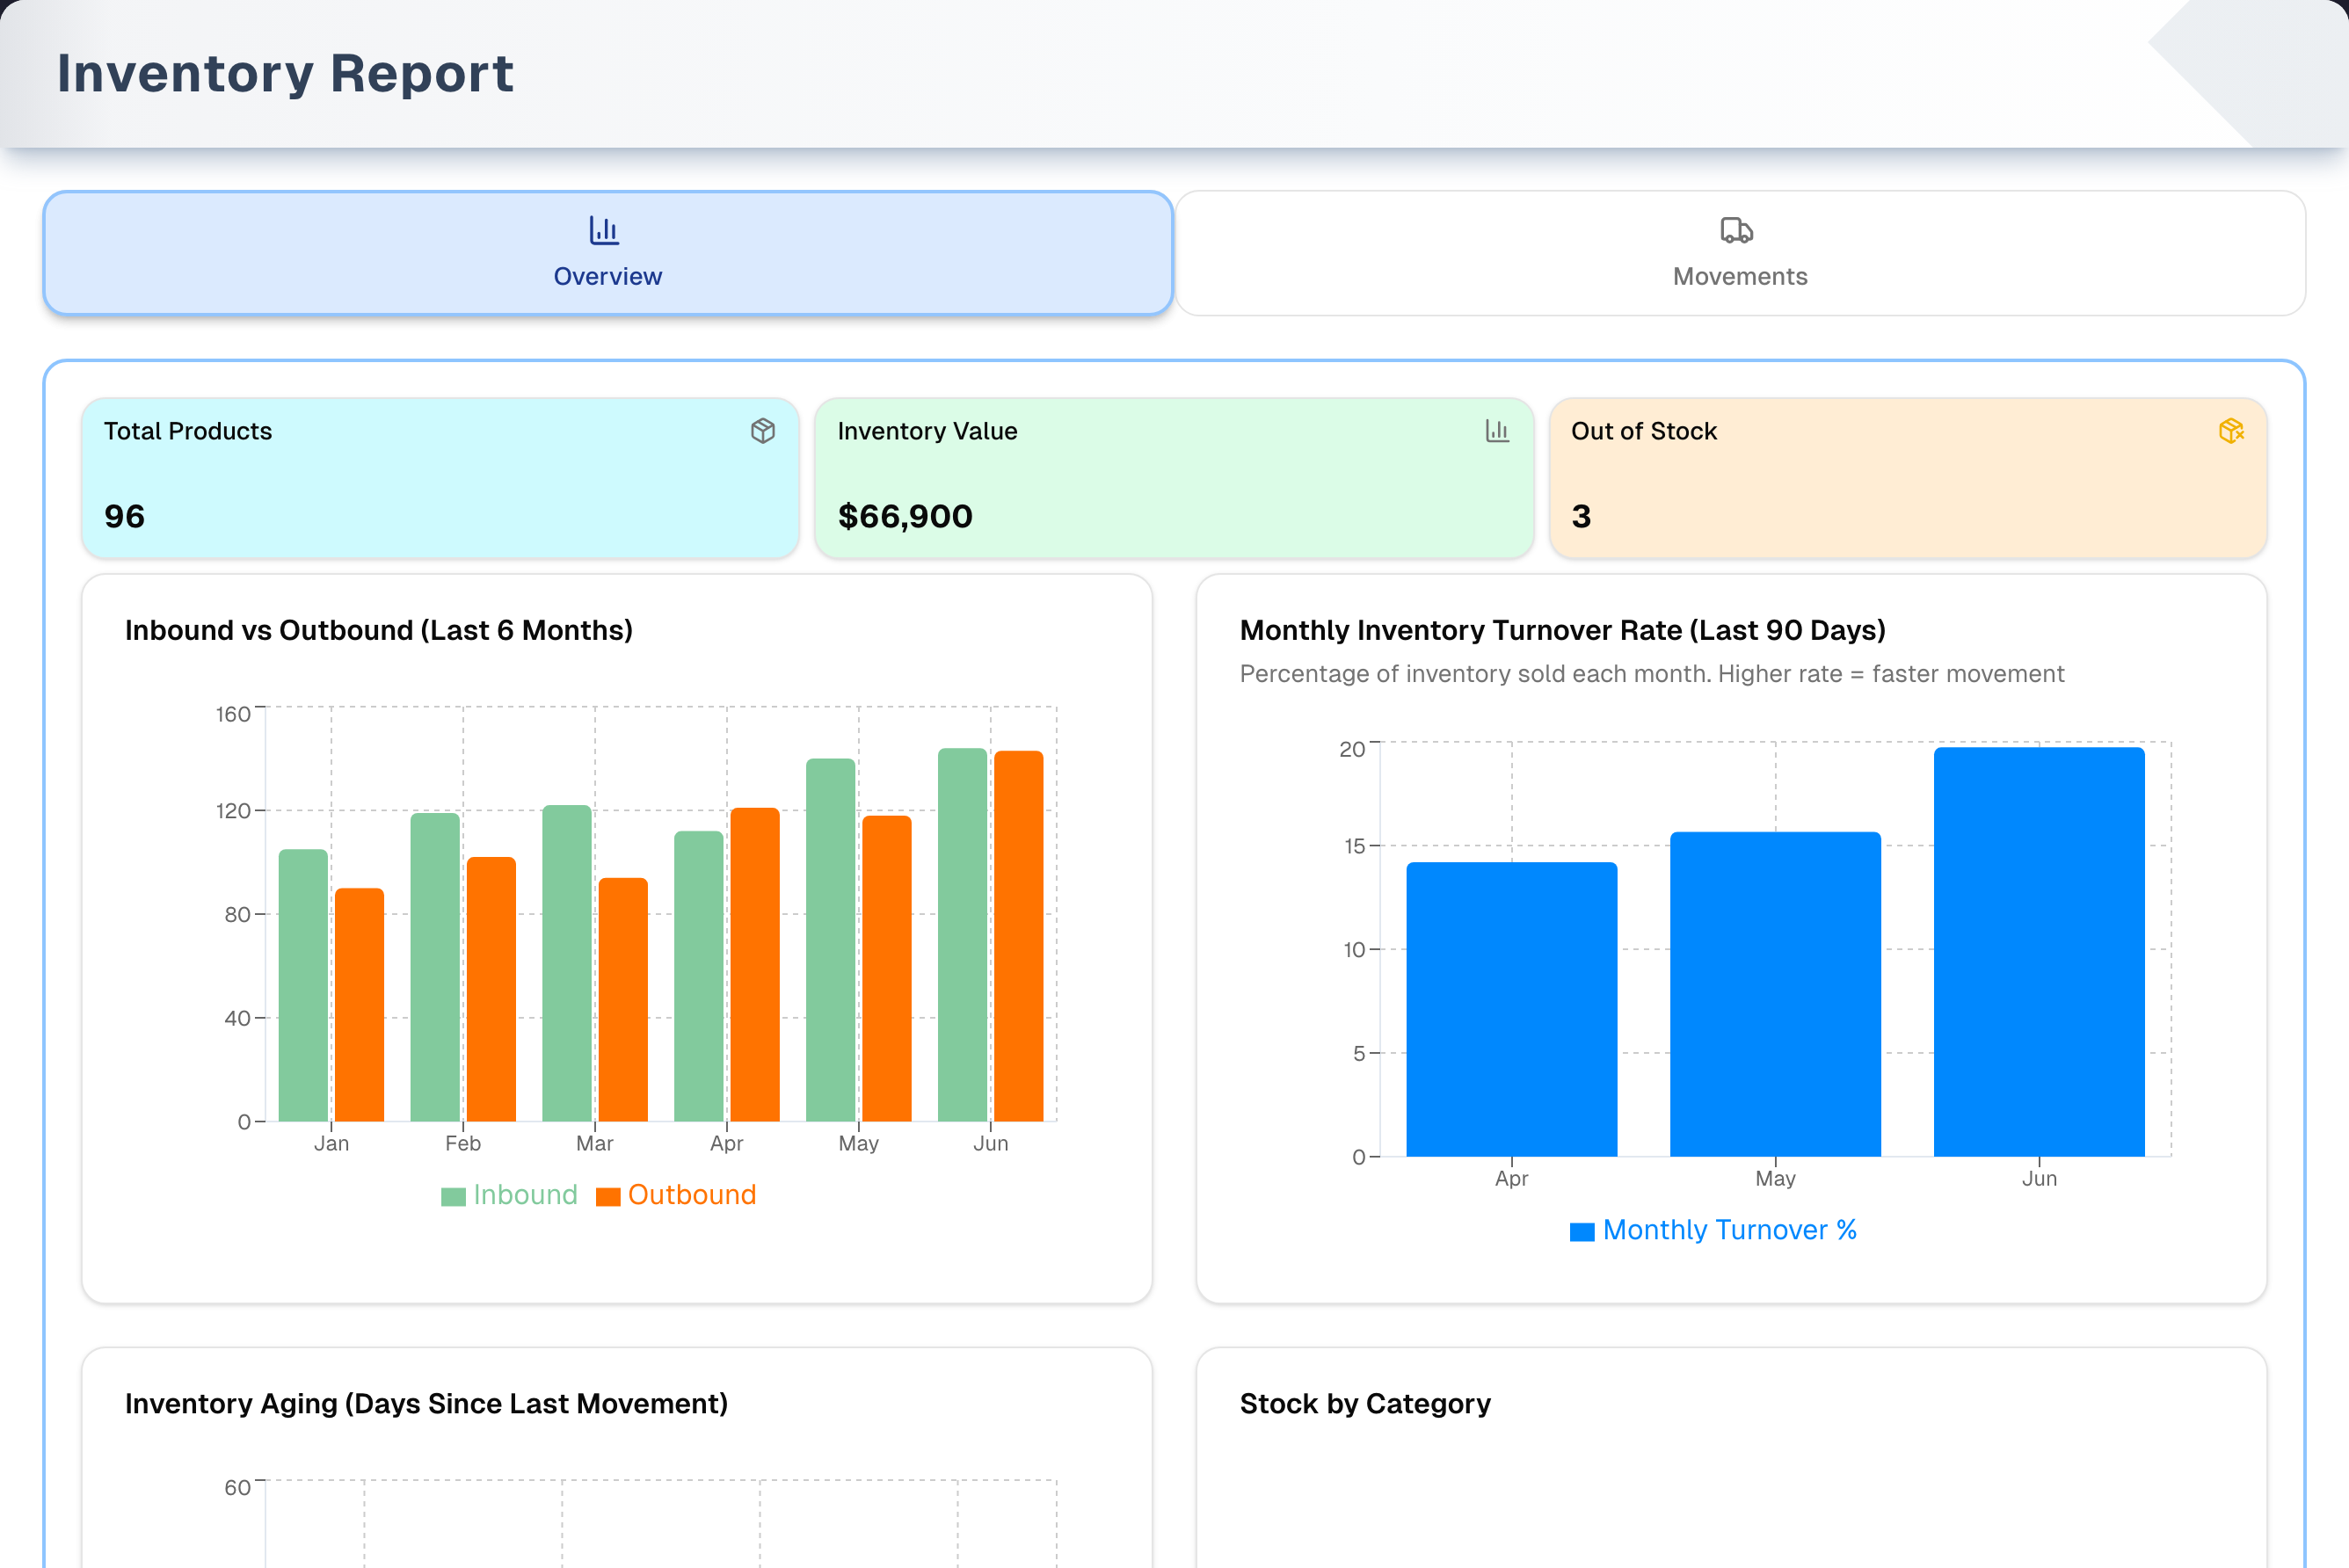
The Overview tab has three KPI cards (product count, value and out-of-stock count), four charts (inbound vs outbound flow, turnover, aging and value by category) and two low-stock panels (Reorder Risk and Low Stock by Category). The Movements tab is a searchable log of your most recent stock movements. The Aged stock tab lists the stock that has been on hand longer than an age you pick (180 days to start), at cost.
You can open the report four ways:
- Reports → Inventory Report in the sidebar.
- The Inventory Report card in the Reports group on Shortcuts.
- History on Inventory → Snapshot, which opens the Movements tab.
- The Inventory turnover card on the Dashboard. The card only appears for store types that have a turnover benchmark.
The report has no export, print, date-range picker, location filter or column sorting.
Tabs in detail
Overview
| Card | What it counts |
|---|---|
| Total Products | Products that have an active stock record at any location, including records at zero. It doesn't count every catalog item |
| Inventory Value | On-hand × average cost from receiving, or the last purchase cost if there's no average. Shown in whole dollars. Stock reserved for orders still counts. The product's Cost Price isn't used |
| Out of Stock | Products with nothing left to sell across all your locations — counted once each, oversold products included, and counting stock that is fully reserved for orders. The icon is grey at 0, yellow at 1–5 and red above 5 |
Clicking any card opens Inventory → Snapshot.
The charts and lists:
- Inbound vs Outbound (Last 6 Months) shows units that came in and units that left in each calendar month, including the current month so far. Months are your store's calendar months, so a late-evening movement counts on the store's day wherever you are reading from. Every movement that changed on-hand stock counts — receipts, sales, transfers, returns, damage, theft and adjustments — on whichever side it moved stock. Reservations don't count, because they don't move stock.
- Monthly Inventory Turnover Rate (Last 90 Days) covers the last 3 calendar months, including the current month so far. Each bar is the units that left the business that month — sold, damaged, stolen or adjusted away — as a percentage of the estimated stock at month end, so it is never below zero. Stock moved between your own locations isn't counted, because nothing left.
- Days since stock last moved counts products by days since their stock last moved, in 0–30, 31–60, 61–90 and 90+ day buckets. A product stocked at several locations counts once, aged by its most recent movement at any of them. A product whose stock has never moved counts as 90+. This is not how long stock has been on hand — one sale makes a shelf of old stock read as moved — so for that, use the Aged stock tab.
- Stock by Category is a pie of inventory value for your top 5 categories only. With more than 5 categories, the slices add up to less than Inventory Value.
- Reorder Risk lists the products that have fallen below the reorder point set for them, the 10 largest shortfalls first, with a link to Procurement. Each product appears once: its stock and its reorder points are added up across your locations, so a product that is thin at one branch and full at another isn't called short. A product with no reorder point is never listed, so the card says which of the two empty cases you are in.
- Low Stock by Category counts the products at or below their minimum level, by category. A product low at three branches counts once, on its stock added up across your locations. A product with nothing available isn't counted — it is already out, not low.
To check stock product by product, use Inventory → Snapshot.
Aged stock
- Lists the stock that has been on hand longer than the age you pick: Over 90 days, Over 180 days (the default) or Over 365 days, for All locations or one location.
- Serialized units are aged from the day each unit came in. A transfer keeps a unit's age, and units held for an order or a damaged return aren't listed.
- Bulk stock is aged first in, first out: of each product's (and variant's) stock across the whole store, whatever is more than what arrived by receiving or opening balance in that many days counts as aged, oldest record first. Transfers, returns, count and audit corrections don't make stock new again.
- Picking one location shows its share of the store-wide answer, so its bulk is marked an estimate.
- Each line shows the product, SKU and variant, location, a Serial or Bulk badge, quantity, value at cost (average cost, else last cost), the day its oldest stock came in and its age in days. The cards above add up the value, the units and bulk, and the oldest age. The value is part of the Snapshot's Total Value.
- Stock opened from a MyStore import is dated at the import, so it reads as new until the age you pick has passed since it (180 days at the default).
- It is the same figure as the Aged stock row in Quick Facts & To-Do, whose View aged stock button opens this tab.
Movements
- Shows your 5,000 most recent stock movements, newest first, 20 per page. If your store has more than that, an amber note above the filters says how many there are in all.
- Filters: Product, Type (Stock In / Stock Out / Adjustment), Stock effect (On-hand only / No on-hand change), From, To and Reason. Results update as you type. Clear Filters appears once any filter is set. From and To search location or customer names. They aren't dates, and the report has no date filter.
- Columns: Date, Product, Type, Quantity (signed), From, To, Reason and Reference. From and To show a location or a blue Customer badge. Hover the badge to see the customer's name.
- Reservation (amber badge) marks rows that only change what is set aside for orders. Back on sale (the same amber badge) marks held stock put back on sale. On-hand stock doesn't move for either.
- Under the table, Net on-hand change adds up the real stock changes across every filtered page. Rows with no on-hand change get a separate total.
Step by step: trace a product's stock
- Open Reports → Inventory Report, or click History on Inventory → Snapshot.
- On Overview, check Out of Stock and Inventory Value. Click a card to open Snapshot for the product-by-product detail.
- On Movements, type the product name into Product. It matches any product whose name contains the text, so type enough to single out the one you want.
- Set Stock effect to On-hand only to hide reservations, then compare Net on-hand change with the product's on-hand count across all locations. The two only line up when all of the product's movements are among the 5,000 the report lists.
Tips & best practices
- Use Aged stock to find stock that has sat on the shelf too long; the 90+ day bucket of Days since stock last moved shows products nothing has happened to lately.
- To trace a product's history, filter Movements to that product, then by Type.
- Use Stock effect → No on-hand change to see stock being set aside for orders and released again, and held stock put back on sale, without any shelf movements.
- Audit corrections and Reset Inventory changes from Snapshot, and posted stock counts from Inventory → Management, show up here as Adjustment rows.
Troubleshooting
| Issue | Fix |
|---|---|
| Out-of-Stock count unexpectedly high | The card counts products with nothing available anywhere, and stock fully reserved for orders counts as unavailable. Click the card to check Snapshot, or filter Movements to the product with Stock effect → No on-hand change |
| Inventory Value is $0 | Value comes from the average or last purchase cost recorded when stock is received. Receive stock with a unit cost. Stock transferred from another location brings that location's average cost with it. The product's Cost Price isn't used |
| Outbound looks higher than my sales | Outbound counts every movement that took stock off the shelf, not only sales: transfers out, damage, theft and downward adjustments are in there too. (The turnover chart is stricter — it leaves transfers between your own locations out.) To see sales alone, use Movements with Type → Stock Out and Stock effect → On-hand only |
| Stock by Category doesn't add up to Inventory Value | The pie shows only the top 5 categories by value |
| An older movement isn't listed | Movements only lists the 5,000 most recent movements |
| Reorder Risk is empty | Either nothing is below its reorder point, or no product has one set — the card says which. Set reorder points on your products so low stock can be flagged |
| "Error Loading Data" | Click Retry, which reloads the page. If it keeps happening, sign out and back in |
| "403 - Forbidden" | The owner has hidden Inventory Report from your menu. Ask them to show it again (see Team) |
What's next
- Replenish at-risk items: Inventory → Procurement
- Verify live stock: Inventory → Snapshot
- Reconcile counts: Inventory → Management
Detailed reference
This section lists every button, icon, field and message on this page, for when you need the exact detail. Each panel starts closed. Open the one you need.
Page header and toolbar
| Control | Where | What it does | Notes |
|---|---|---|---|
| Inventory Report (boxes icon) | Sidebar, Reports group | Opens the report on the Overview tab | Hovering it shows a short description of the page. In stores with more than one active person, the owner can hide it per team member |
| Inventory Report card | Shortcuts, Reports group | Opens the report on the Overview tab | Hidden too when the owner hides the menu item for you |
| History (clock icon) | Inventory → Snapshot toolbar | Opens the report on the Movements tab | Everyone who can see Snapshot |
| Inventory turnover card (repeat icon, for example "3.2×") | Dashboard, Level 02 Organized | Opens the report on the Overview tab | Shown only for store types with a turnover benchmark |
| Page title Inventory Report | Header, left | Subtitle: "Monitor stock levels, track inventory movements, and analyze inventory performance." | Static text |
| Demo (Play icon, amber) | Header, right | Opens the report with sample data and a guided tour | Always shown. See the Demo mode panel below |
| Overview tab (bar-chart icon, blue) | Tab bar | Shows the KPI cards, four charts, Reorder Risk and Low Stock by Category | Default tab. Left and Right arrow keys move between tabs when the tab bar has focus |
| Movements tab (truck icon, purple) | Tab bar | Shows the movement log with filters, totals and pages | Switching tabs doesn't change the web address |
| Aged stock tab (hourglass icon, orange) | Tab bar | Shows the stock on hand longer than the age picked, with a location picker | Reads every aged line; the location and age pickers reload it |
Web address ending ?tab=movements, ?tab=overview or ?tab=aged | Browser address bar | Opens the report on that tab; with ?tab=aged&location=<id>, the Aged stock tab starts on that location | Any other value opens Overview. A location your store doesn't list reads as All locations |
| "Loading inventory data..." spinner | Whole page | Shown while the report loads | Tabs appear once everything has loaded |
| Retry (refresh icon) | "Error Loading Data" screen | Reloads the whole browser page | Only on the error screen |
The header has no export, print, date-range or location control. All data covers the current store, all locations combined.
Tab: Overview
The Overview tab has no filters. Everything is calculated for the whole store as of now.
KPI cards
| Control | Where | What it does | Notes |
|---|---|---|---|
| Total Products (package icon, cyan card) | KPI row, 1st | Number of different products that have an active stock record | Includes records at zero stock. Not a count of your whole catalog. Click opens Inventory → Snapshot |
| Inventory Value (bar-chart icon, green card) | KPI row, 2nd | Sum of on-hand × average cost, or last purchase cost when there's no average, in whole dollars | $0 when no cost has been recorded or nothing is on hand. Stock reserved for orders still counts. The product's Cost Price isn't used. Click opens Snapshot |
| Out of Stock (package-x icon, orange card) | KPI row, 3rd | Number of products with nothing available, adding up every location | Caption under the figure: "Products with none left to sell across all locations, oversold included". A product counts when its available quantity across all locations is 0 or below, so oversold products count too, and one out at a single branch while stocked elsewhere does not. Fully reserved stock counts as unavailable. Icon colour: grey at 0, yellow at 1–5, red above 5. The card itself stays orange. Click opens Snapshot |
| Card hover | Any KPI card | Thicker border and shadow | All three cards open the same Snapshot page |
Charts
| Control | Where | What it does | Notes |
|---|---|---|---|
| Inbound vs Outbound (Last 6 Months) | Charts, top left | One pair of bars per calendar month, 6 months including the current month so far. Green Inbound = units that came in. Orange Outbound = units that left | Subtitle: "Units that came in and units that left each month, counting every movement that changed on-hand stock". Months are your store's calendar months (Settings → Organization; with none set, your computer's), the same clock the Movements table below uses. Every on-hand movement counts on the side it moved stock: receipts and returns in, sales, transfers out, damage, theft out, and adjustments either way. Reservations are left out. Both bars are counts of units, so neither can be below zero. Months with no activity show 0 |
| Hover a bar | Inbound vs Outbound | Shows the month and "Inbound : N" / "Outbound : N", with thousands commas | The legend under the chart only labels the colours. The side axis is short ("1.2K") |
| Monthly Inventory Turnover Rate (Last 90 Days) | Charts, top right | Blue bars for the last 3 of your store's calendar months, including the current month so far: the units that left the business that month ÷ estimated stock at month end × 100 | Subtitle: "Units that left the business as a percentage of stock on hand that month. Moves between your own locations don't count. Higher rate = faster movement". Legend: Monthly Turnover %. Sales, damage, theft and downward adjustments count; a transfer between two of your locations does not, so rebalancing branches doesn't lift the rate. Month-end stock is worked back from today's total available stock, because the report keeps no record of past stock levels. It is never below 1, and the rate is never below zero |
| Hover a bar | Turnover chart | Shows "Monthly Turnover % : 12.34" (up to two decimals) | — |
| Days since stock last moved | Charts, bottom left | Four bars: 0-30, 31-60, 61-90, 90+. Each counts products by days since their stock last moved at any location. Subtitle: "Products by days since their stock last moved at any location. For how long stock has been on hand, see Aged stock." | One count per product, like Total Products: a product at three locations counts once, in the bucket of its most recent movement anywhere. Includes products at zero stock. A product whose stock has never moved counts as 90+. No legend |
| Hover a bar | Days since stock last moved chart | Shows "Products : N" | — |
| Stock by Category | Charts, bottom right | Pie of inventory value per product category, top 5 categories only, in whole dollars | Products with no category are grouped as "Uncategorized". With more than 5 categories the slices add up to less than Inventory Value. Each slice has its own colour. The pie is empty when no stock has a value |
| Hover a slice | Stock by Category | Shows the category name and its value, as "Category : $1,234.00" | The value is rounded to whole dollars |
| Legend | Under the pie | Lists the category names with their colours | Display only. Clicking it does nothing |
| Reorder Risk | Charts, after Stock by Category | A table of Product, SKU, Available, Reorder point and Short by, for products whose available stock is under the reorder point set for them | Subtitle: "Products below the reorder point set for them, the 10 largest shortfalls first. Stock and thresholds are combined across your locations, and products with no reorder point are not listed". One row per product, never one per location: Available and Reorder point are that product's totals across every location, as on the Out of Stock card. Biggest shortfall first, at most 10 rows. A product sitting exactly on its reorder point is not listed. A product sold past zero shows a shortfall larger than its reorder point. Rows aren't clickable |
| Restock in Procurement | Reorder Risk, under the table | Opens the Orders tab of Procurement, the same page as Procurement in the sidebar | Only shown when at least one product is listed. Opens in the same tab, so use Back to return to the report |
| "Nothing is below its reorder point." | Reorder Risk, in place of the table | Every product with a reorder point is at or above it | — |
| "No product has a reorder point yet. Set one on a product to see it here." | Reorder Risk, in place of the table | No product in your store has a reorder point | Set one with Edit levels in Product Details on Inventory → Snapshot |
| Low Stock by Category | Charts, last | Orange bars counting the products at or below their minimum level, by category, the 10 busiest categories | Subtitle: "Products at or below their minimum level, by category. Products that are out of stock are not counted". Each product counts once, on its stock and minimum levels added up across your locations. Legend: none. Products with no category are grouped as "Uncategorized" |
| "Nothing is at or below its minimum level." | Low Stock by Category, in place of the chart | No product is low | — |
To check stock product by product, use Inventory → Snapshot.
Tab: Movements
Card title Recent Stock Movements, with the description "Latest inventory movements and adjustments. Rows marked Reservation only change what is committed to orders — on-hand stock does not move." It lists your 5,000 most recent movements, newest first. Filtering and paging happen on that set. When the store has more, an amber note sits above the filters: "Showing the latest 5,000 of 12,480 movements. The filters and the totals below cover these 5,000 only."
Filters
All text filters match any part of the text and ignore upper and lower case. Results update as you type or choose, and each change goes back to page 1.
| Control | Where | What it does | Notes |
|---|---|---|---|
| Product (placeholder "Search products...") | Filter bar, 1st | Keeps rows whose product name contains the text | Matches the name shown in the table (or the SKU when a product has no name). Doesn't search serial numbers |
| Type: All Types / Stock In / Stock Out / Adjustment | Filter bar, 2nd | Keeps rows with that type badge | Adjustment also covers transfers, returns, damage and theft |
| Stock effect: All Effects / On-hand only / No on-hand change | Filter bar, 3rd | On-hand only keeps rows that changed shelf stock. No on-hand change keeps the rows with a Reservation or Back on sale badge | Works in the demo too |
| From (placeholder "Filter by source...") | Filter bar, 4th | Keeps rows whose From location or customer name contains the text | Also matches the customer name behind a Customer badge. Rows showing "-" drop out while it's set. It isn't a date |
| To (placeholder "Filter by destination...") | Filter bar, 5th | Same as From, for the To column | It isn't a date |
| Reason (placeholder "Filter by reason...") | Filter bar, 6th | Keeps rows whose reason contains the text | — |
| Clear Filters | Under the filter bar | Resets all six filters to their defaults | Only visible when at least one filter is set. A text box holding only spaces doesn't count as set, because it doesn't filter anything |
There is no date filter. To reach older rows, narrow the list with Product and Type, then page through.
Table
The table has no row click, no row menu and no column sorting.
| Column / element | What it shows | Notes |
|---|---|---|
| Date | Date of the movement, like "Sep 18, 2026", in your store's time zone | No time of day |
| Product | Product name | Falls back to the SKU, then "Unknown Product" |
| Type badge | Stock In (green), Stock Out (red) or Adjustment (grey) | Adjustment covers adjustments, transfers, returns, damage and theft |
| Reservation badge (amber) | Sits under the type badge. The row only changed what is set aside for orders, and on-hand stock didn't move | Examples: an order reservation, or a reservation released by a cancel or edit |
| Back on sale badge (amber) | Sits under the type badge. Held stock was put back on sale: it moved from held to available, and on-hand stock didn't move | Reason "Held stock put back on sale" |
| Quantity | What the row did to stock on the shelf: "+N" in green when it added stock, "-N" in red when it took stock away. A zero shows "0" | Damage, theft and a transfer out read as losses even though their badge says Adjustment, and the charts above count them the same way. Reservation rows are grey |
| Quantity hover | "Reservation only — on-hand stock did not change", or "Held stock put back on sale — on-hand stock did not change" on a Back on sale row | Rows with no on-hand change only |
| From | Stock Out and adjustments: the location the stock left or was adjusted at. Stock In: the source location, when one was recorded, or a Customer badge when that row belongs to a customer's order | "-" when there's none. If a location's name can't be found, its ID shows instead |
| To | Stock Out for a customer order: a Customer badge. Otherwise the destination location. Stock In: the receiving location | "-" for most adjustments that aren't transfers |
| Customer badge (blue) | In From or To | Hover shows the customer's name |
| Reason | The reason recorded with the movement | Falls back to the movement's notes, then its kind (for example Outbound, Transfer, Return), then "No reason provided" |
| Reference (fixed-width text) | A record type and ID joined by a dash, for example ORDER_ITEM-… (order lines and returns), ORDER-… (some older returns, which name only the order; a data clean-up may fill in the line on one where it is certain, and its note then ends "[Order line filled in by a data clean-up on …. Before, this return named only order ….]"), RECEIVING-…, TRANSFER-…, SCRAP-…, AUDIT-…, RESET-…, COUNT_RECORD-… (stock counts), COUNT_SESSION-… or INVENTORY_ITEM-… (a serialized unit switched to Not Available or back), ORDER_DELETE-… (deleted orders) or PO_DELETE-… (deleted purchase orders). "REF-…" when no type was recorded. Otherwise the order number, else "-" | Not a link |
| "No movements found matching the current filters." | One line across the table | Shown when no rows match, or the store has no movements yet |
Reasons you'll often see
| Reason | Type badge | Reservation badge? | What happened |
|---|---|---|---|
| Order fulfillment | Stock Out | No | Stock left the shelf for an order |
| Order reservation | Stock Out | Yes | Stock was set aside for an order |
| Order cancelled - reservation released | Adjustment | Yes | A cancelled order gave back its reserved stock |
| Order deleted - reservation released | Adjustment | Yes | A deleted order gave back its reserved stock |
| Order deleted - fulfillment reversed | Adjustment | No (some older rows show Yes) | A completed order was deleted and its goods went back into stock. The order's original Order fulfillment row stays in the list, so the two cancel out in Net on-hand change |
| Order line removed (reservation released) | Adjustment | Yes | A line was removed from an order |
| Order quantity edit (reservation adjustment) | Adjustment | Yes | An order line's quantity changed before fulfillment |
| Order quantity edit (fulfillment adjustment) | Adjustment | No | A fulfilled line's quantity changed |
| Inventory receiving / Inventory receiving correction | Stock In / Adjustment | No | Stock was received, or a receipt was corrected |
| The return reason entered, or "Returned from order … Condition: …" when none was entered | Adjustment | No | Returned stock was put back into inventory |
| Procurement order deleted - receipt reversed | Adjustment | No | A deleted purchase order took its received stock back out |
| Inventory scrapped - damage / Inventory scrapped - theft, or the reason typed when scrapping | Adjustment | No | Stock was scrapped (damage or theft) |
| Transfer Outbound / Transfer Inbound | Adjustment | No | Stock moved between two of your locations |
| Inventory count adjustment | Adjustment | No | A posted stock count from Inventory → Management changed on-hand |
| Unit marked not available / Unit marked available | Adjustment | No | A serialized unit was switched to Not Available (on-hand −1) or back to Available (+1, giving back that −1) on Inventory → Management, from Search or during a count. A switch that doesn't change on-hand (at 0, or on some older Not Available units) records no movement |
| Audit correction — ledger reconciliation / Audit correction — negative stock reset to zero / Audit correction — reconcile stock to tracked items | Adjustment | No | Fixes applied from Audit on Snapshot. "Negative stock reset to zero" appears on older fixes only: the Audit leaves a shortfall for review rather than resetting it |
| Audit correction — orphaned reservation released | Adjustment | Yes | An Audit fix freed stock that was set aside for no open order |
| Held stock put back on sale | Adjustment | No: a Back on sale badge | A manager put stock that was held off sale back on sale. It moves from held to available, and on-hand doesn't change |
| Inventory reset to zero | Adjustment | No | Reset Inventory on Snapshot |
| Audit correction — ledger semantics re-baseline | Adjustment | No | A one-time correction, dated July 2026, that makes the movement history add up to the on-hand count. Shelf stock didn't change |
Totals and pages
| Control | Where | What it does | Notes |
|---|---|---|---|
| "Net on-hand change (… of … filtered rows): …" | Under the table | Signed total of the rows that changed on-hand stock, across all filtered pages | Shown when at least one row matches |
| "Rows with no on-hand change: … (net … available)" | Same line, grey | Count and signed total of the Reservation and Back on sale rows, kept apart from the on-hand net | Only when the filtered rows include one |
| "Showing … to … of … movements" | Bottom left | Current range and total, 20 rows per page | "Showing 0 to 0 of 0 movements" when nothing matches. The total never goes above 5,000; the amber note above the filters says how many movements the store has in all |
| Previous | Bottom right | Goes back one page | Greyed out on page 1 |
| Page number buttons and "..." | Bottom right | Jump to that page. The first page, the last page and the pages next to the current one are shown. The current page is filled in | "..." marks skipped pages |
| Next | Bottom right | Goes forward one page | Greyed out on the last page or when there are no results |
| "Loading movements..." | Table area | Spinner while movements load | Rarely seen, because the whole-page loader covers it |
Messages you may see
| Message | When it appears | What to do |
|---|---|---|
| "Loading inventory data..." | While the report loads | Wait |
| "Loading..." | While the app checks your menu access, before the page shows | Wait |
| "Error Loading Data" with a reason and Retry | Any part of the report failed to load | Click Retry (reloads the page). If it keeps happening, sign out and back in, then contact support with the message text |
| "No organization found for your account. Please sign in again." | Your session isn't linked to a store | Sign out and sign back in |
| "Could not read your organization. Please sign in again." | The app couldn't read your session | Sign out and sign back in |
| "No organization selected" | The store couldn't be identified while loading | Sign in again |
| "An error occurred" | An unknown error while loading | Click Retry. If it repeats, contact support |
| A technical database message | A data request failed | Click Retry. If it repeats, send support the exact text |
| "403 - Forbidden" / "You do not have permission to view this page. Contact your organization owner." | The owner has hidden Inventory Report from your menu and you opened it directly | Ask the owner to show it again (see Team) |
| "Units that left the business as a percentage of stock on hand that month. Moves between your own locations don't count. Higher rate = faster movement" | Always, under the turnover chart title | Information only |
| "Latest inventory movements and adjustments. Rows marked Reservation only change what is committed to orders — on-hand stock does not move." | Always, on the Movements card | Information only |
| "No movements found matching the current filters." | No rows match, or there are no movements yet | Click Clear Filters or widen the filters |
| "Reservation only — on-hand stock did not change" / "Held stock put back on sale — on-hand stock did not change" | Hovering a grey quantity | Information only |
| "Net on-hand change (… of … filtered rows): …" / "Rows with no on-hand change: … (net … available)" | At least one row matches the filters | Information only |
| "Showing … to … of … movements" | Always, under the table | Information only |
| Out of Stock icon colour | Grey at 0, yellow at 1–5, red at more than 5 | Red means more than 5 products have nothing available |
The report shows no pop-up notifications.
Who can use what
- Plans: available on every plan and during the free trial. It needs no add-on and has no feature switch.
- Roles: owners, managers and staff see the same report. Nothing on it changes data.
- Menu visibility: in stores with more than one active person, the owner can hide Inventory Report for a team member in Settings → Team. That person gets "403 - Forbidden" if they open the page directly. Nothing is blocked while the store has only one active person: people switched off or removed in Team don't count.
- Data limits: the KPI cards, the Days since stock last moved chart and the Stock by Category pie cover every active stock record you have, and the two monthly charts cover every on-hand movement of the last 6 months, however many there are. Movements lists the 5,000 most recent movements, and says so above the table when your store has more.
Demo mode (/reports/inventory/demo)
- Open it: click Demo (Play icon, amber) in the page header, right.
- Header: "Inventory Report — Demo", subtitle "Sample inventory report populated with demo data. Filters and paging work on it; nothing can be changed."
- Banner: "Demo mode — report is populated with sample data. Filters and paging work on it; nothing can be changed." (eye icon), with Take a Tour (question-mark icon) at its right end.
- Still works: the Overview and Movements tabs, chart hover details, the Customer badge hover and the Reservation / Back on sale hover text, Take a Tour and Exit Demo Mode — and, on Movements, the Product, Type, Stock effect, From, To and Reason filters, Clear Filters and the Previous / page number / Next buttons, so all 35 sample movements can be read.
- Disabled: the KPI cards don't open anything, and don't light up on hover as the live ones do.
- Tour: starts automatically the first time the demo opens, and each step switches to its tab. Take a Tour restarts it from step 1. It shows dots and an "N of 6" counter, Back (from step 2 on), Skip (closes), Next, and Got it! on the last step (closes). Keyboard: Esc closes, Right arrow or Enter goes to the next step (closes on the last), Left arrow goes back. Clicking the dark background closes the tour. If a step's target doesn't appear within about 3 seconds, the tour moves to the next step.
- Leave: Exit Demo Mode (arrow icon, header right) returns to the live report.
| # | Tab | Tour step | What it points at |
|---|---|---|---|
| 1 | Overview | Report Tabs | The tab bar. "Switch between the Overview tab for visual analytics and charts, and the Movements tab for a detailed log of every stock transaction. This tour walks through both." |
| 2 | Overview | Key Metrics | The KPI cards. "At-a-glance inventory health: total unique products tracked, total inventory value at cost, and how many items are currently out of stock." |
| 3 | Overview | Analytics Charts | The charts grid. "Inbound vs Outbound flow by month, Monthly Turnover Rate (higher = faster-selling), Days since stock last moved and Stock Value by Category, then Reorder Risk (the products furthest below their reorder point) and Low Stock by Category." |
| 4 | Movements | Movement Filters | The filter bar. "Narrow the transaction log by product, movement type (in, out, or adjustment), stock effect (rows that moved on-hand stock, or reservations that did not), source location, destination, or reason. Clear all filters with one click. These work here on the sample rows — try them." |
| 5 | Movements | Stock Movement Log | The movements table. "Every inventory transaction in one place — date, product, type, quantity, from/to locations, reason, and reference. Customer locations show a badge with full details on hover." |
| 6 | Movements | Browse Movements | The page controls. "Movements are paginated for fast scanning — twenty to a page. Page through the sample history while the filters above keep the list focused on what you care about." |
Differences from the live page:
- The sample products match your store's industry, with electronics samples when there's no match. None of your real stock is shown.
- KPI cards: Total Products is 96. Inventory Value is a sample figure. Out of Stock is 3, with a yellow icon.
- The Inbound vs Outbound and turnover numbers are random and change on every visit. Days since stock last moved is fixed at 42 / 28 / 15 / 11.
- Movements has 35 sample rows. Locations are Main Warehouse, Store Front, Overflow Storage and Vendor Warehouse, the customers are Maria Johnson and James Williams, and references look like ORD-20… and ADJ-10…. Two rows are order reservations and one is held stock put back on sale: they carry the Reservation and Back on sale badges, and the line under the table counts them apart from the 32 that moved on-hand stock.
- The demo is the live report drawn on sample data: the same tabs, cards, charts, filters, table and totals. Not in the demo: the loading and error screens, and the note that only the latest 5,000 movements are shown.
- Quantity is signed and coloured as on the live page: "+N" in green, "-N" in red, so a negative adjustment reads "-1".
- Reorder Risk and Low Stock by Category are the live page's own cards, worked out the same way from fixed sample stock: five sample products below their reorder point (one of them out of stock) and three at or below their minimum. Their Restock in Procurement link opens the real Procurement page.
See Demo mode for how demos work across the app.
Common questions
Where is the Reorder Risk table? On the Overview tab, under the charts. It lists the products below the reorder point set for them, the 10 largest shortfalls first, and links to Procurement to restock. Each product appears once, on its stock added up across every location. Products with no reorder point are never listed. For stock product by product, use Inventory → Snapshot.
Why does Out of Stock show more than I expect? It counts products, once each, whose available quantity across every location is 0 or below. Stock that is fully reserved for orders counts as unavailable, and oversold products (below 0) count too. A product that is out at one location but in stock at another isn't counted — you can still sell it.
What does the amber Reservation badge mean? The row only changed what is set aside for orders, such as a new order reservation or a reservation released by a cancel or edit. On-hand stock didn't move. That's why these rows are grey and counted separately under the table. Use Stock effect → On-hand only to hide them. A Back on sale row is grey for the same reason: held stock went back to available, and on-hand didn't move.
What is in the Outbound bars? Every movement that took stock off the shelf that month: sales, transfers out, damage, theft and downward adjustments. They are counts of units, so the bars never go below zero, and neither does the turnover rate built from them. To see sales alone, use Movements with Type → Stock Out and Stock effect → On-hand only.
Can I export this report, pick a date range or filter by location? No. The report has no export or print, no date-range picker and no location filter. It always covers the whole store, all locations combined. On Movements, the From and To filters search location and customer names, so you can use them to narrow the log to one location.
Why is Inventory Value $0, or different from my product costs? Value is on-hand × the average cost recorded when stock is received, or the last purchase cost if there's no average. Stock transferred between your locations keeps the average cost it had where it came from. The product's Cost Price isn't used. Receive stock with a unit cost to give it a value.
I can't find an older movement. Movements lists only your 5,000 most recent movements. Older ones aren't shown on this page.
Can I use the filters and pages in the demo? Yes. On Movements, the Product, Type, Stock effect, From, To and Reason filters, Clear Filters and the page buttons all work on the 35 sample rows. Only the KPI cards on Overview don't open anything.