Services Report
Service Reports show how your service operation performs across two tabs — Service Report and Agent Performance.
Overview
A dashboard of service KPIs and charts, plus a per-technician leaderboard for coaching.
Tabs in detail
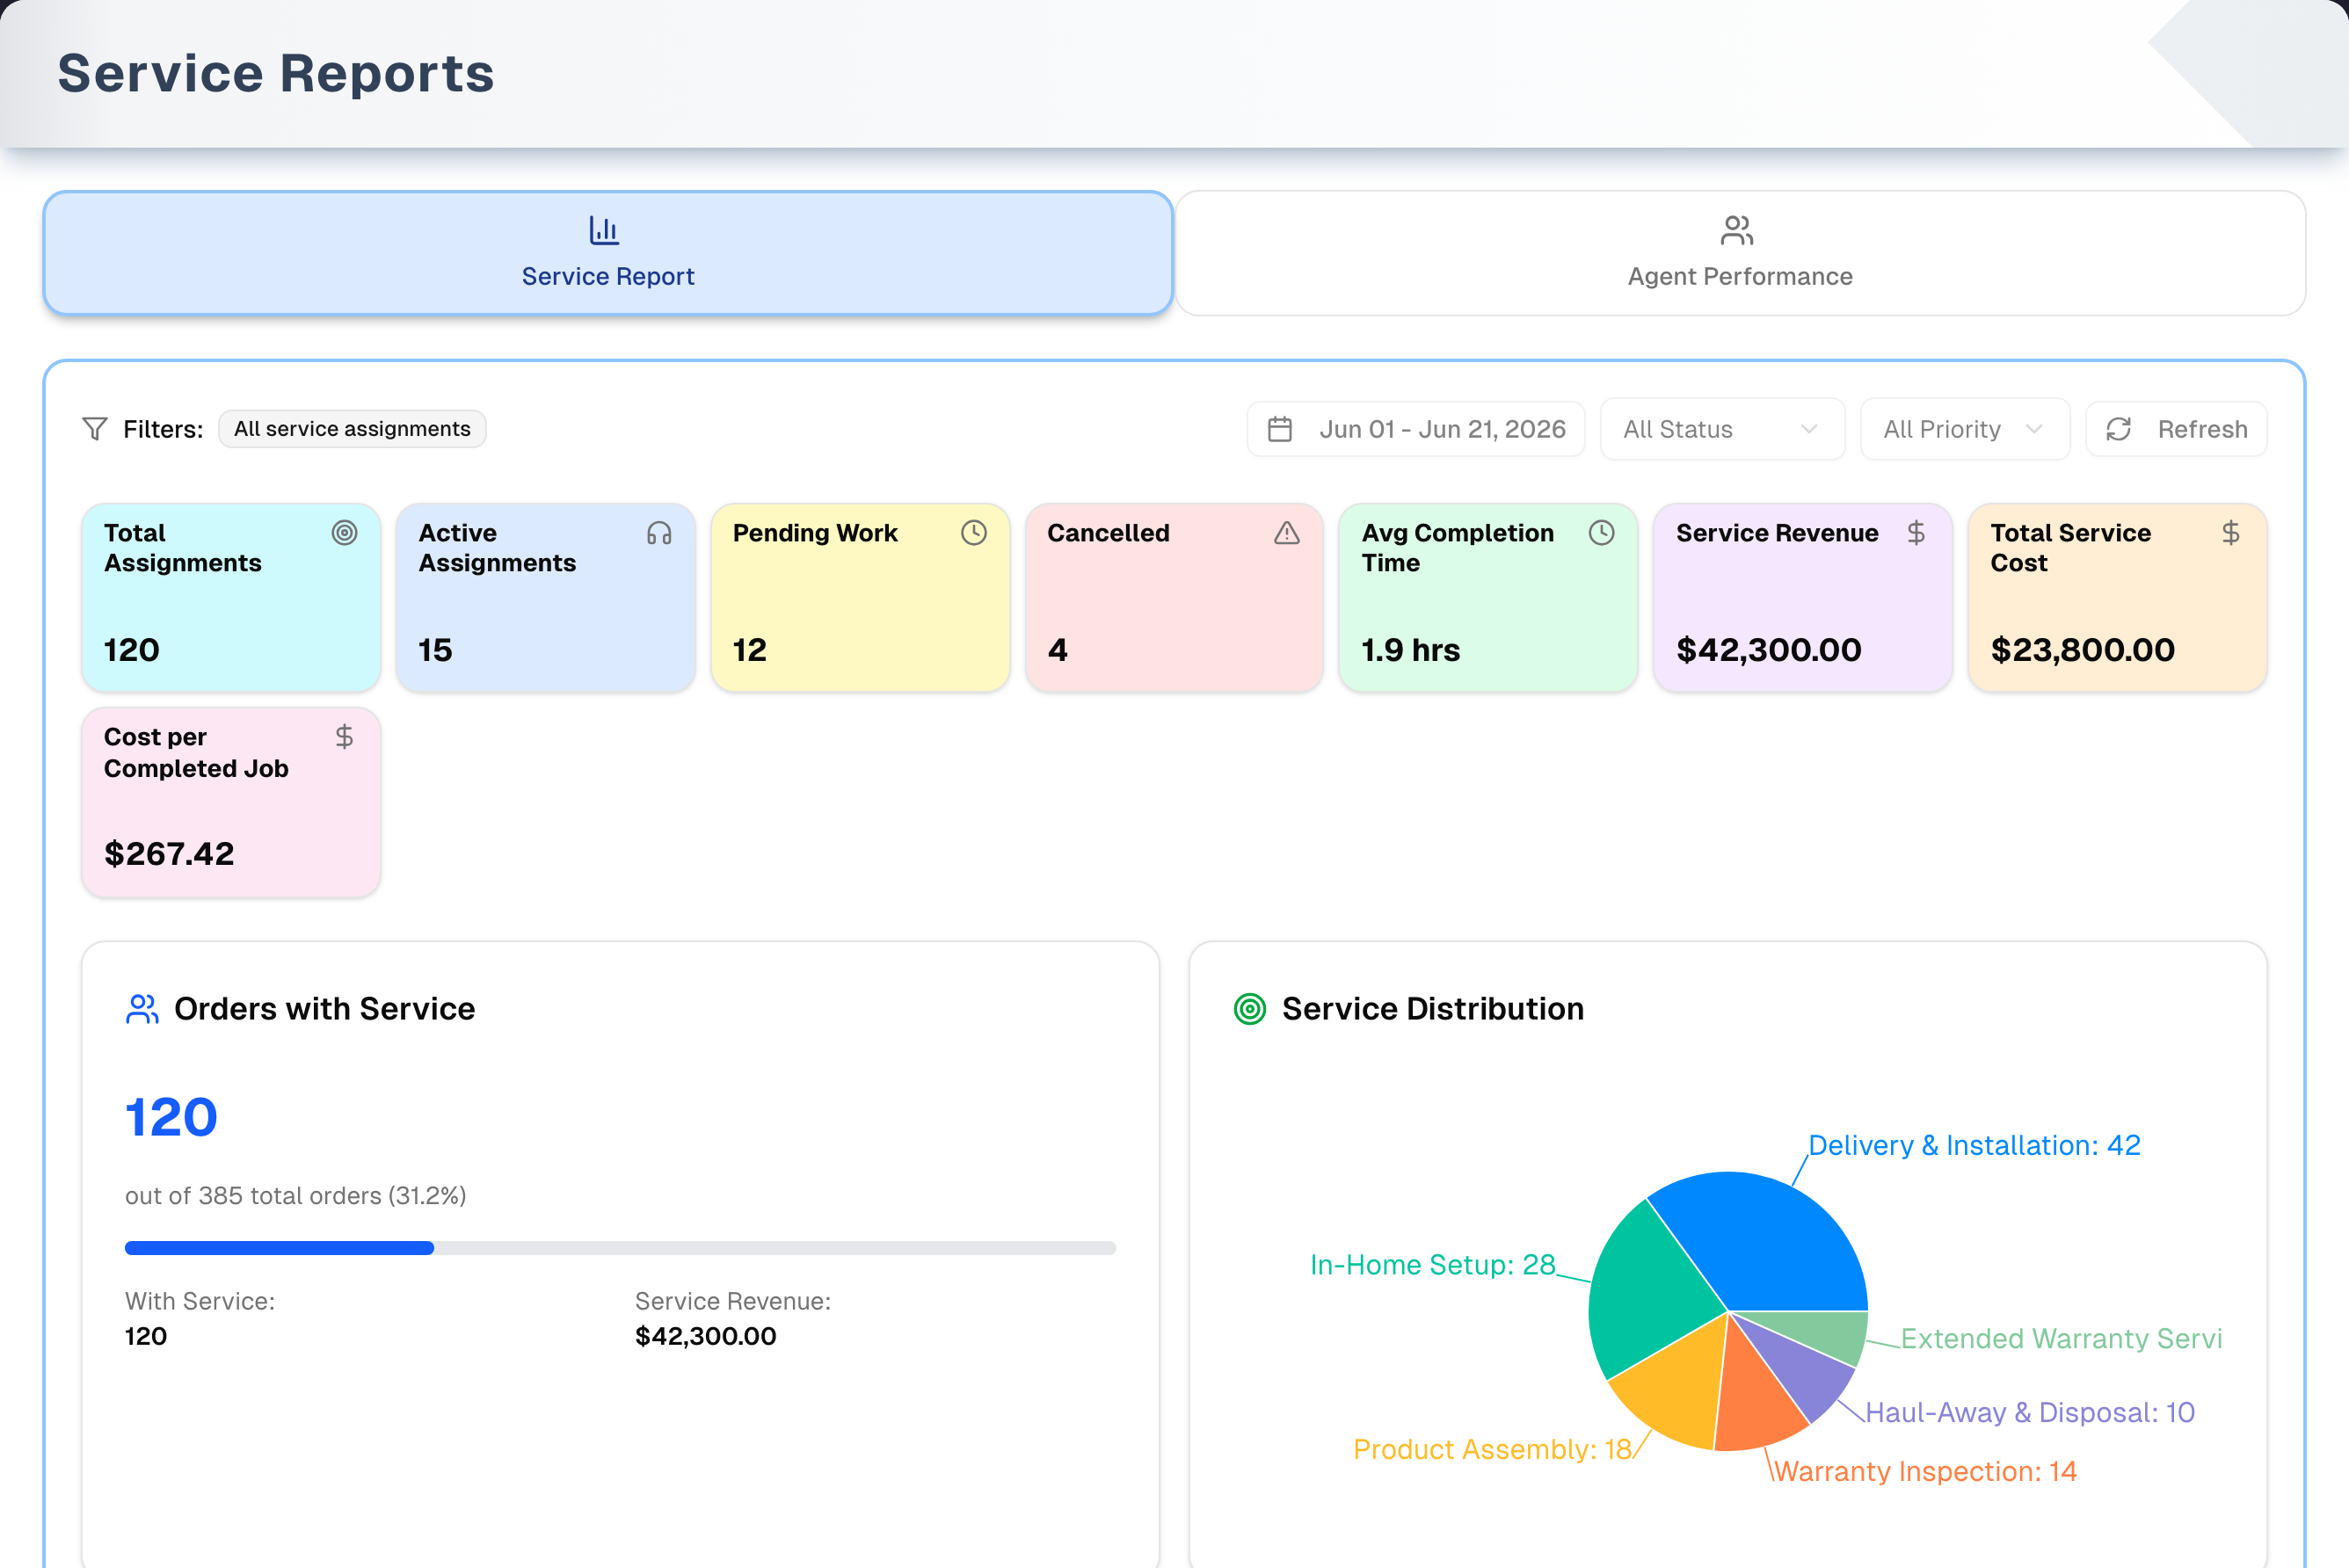
Service Report
- KPI cards: Total Assignments, Active, Pending, Cancelled, Avg Completion Time, Service Revenue, Total Service Cost, Cost per Completed Job.
- Filters: date range, Status, Technician, Priority, Urgent toggle; Refresh.
- Charts: Service Distribution (pie by type) and an Orders-with-Services timeline (revenue, completed, pending).
Agent Performance
- Summary cards: Total Workers, Total Assignments, Avg Completion Rate, Avg Customer Rating, Total Team Cost.
- Leaderboard table: rank, worker, total jobs, completed, pending, completion rate (with bar), customer rating, avg completion time, total job cost, performance badge.
- Sort by completion rate, assignments, rating, or cost.
Step by step: review service performance
- On Service Report, scan the KPI cards and charts.
- On Agent Performance, sort to find top and bottom performers.
Tips & best practices
- Watch Completion Rate week to week — sudden drops hint at staffing/scheduling issues.
- Pair assignment volume with rating to spot standout technicians.
- Use the agent view to target coaching where ratings lag.
Troubleshooting
| Issue | Fix |
|---|---|
| KPIs show zero | No service assignments yet — create them in Sales → Schedule |
| Agent table empty | Technicians aren't assigned to jobs — assign them on the schedule |
| Charts show "No data" | No completed assignments in range — widen the window |
What's next
- Schedule more work: Sales → Schedule
- Manage service offerings: Catalog → Services
- Tie service to revenue: Reports → Sales Report