Expenses Report
The Expenses Report turns the expenses your team records into numbers and charts: totals and averages, a monthly trend, spending by category, receipt coverage, and what is still owed back to staff. It is read-only and has no list of expenses. To review, approve or mark expenses reimbursed, use Finance → Expenses.
Open it from Reports → Expenses Report in the sidebar, or with Open Expenses report on the Income Tax Prep page.
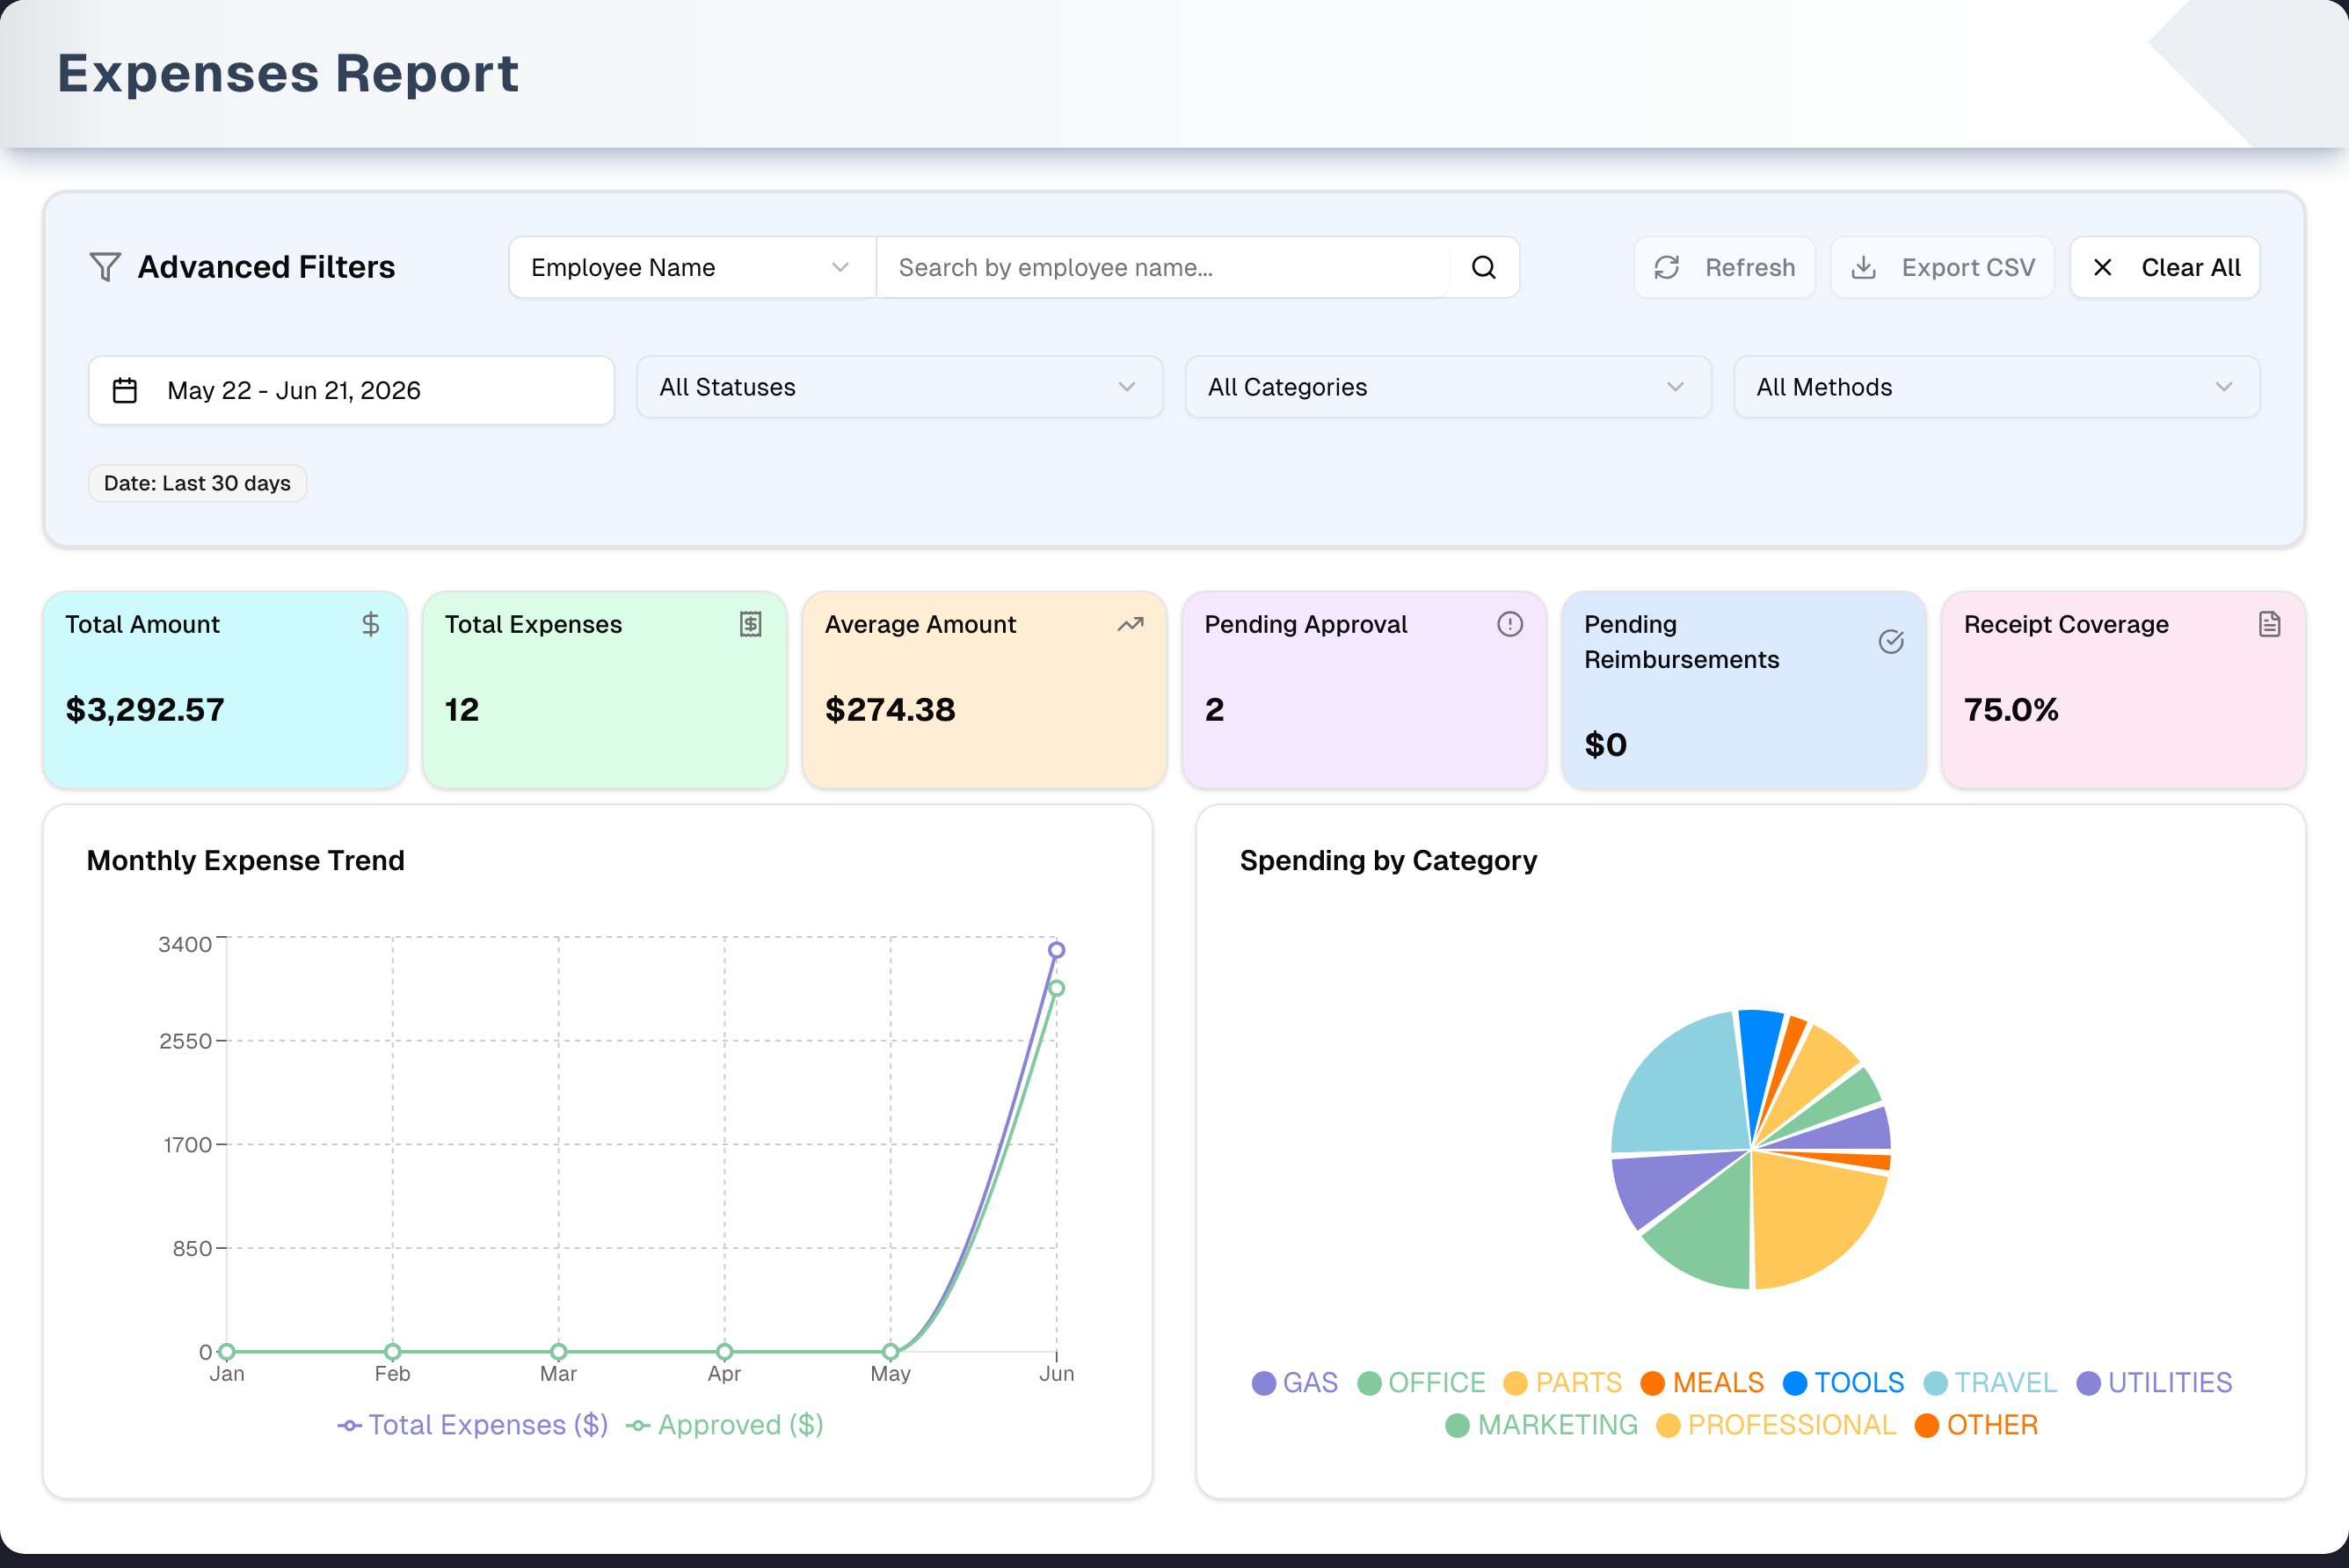
The screenshot shows the demo copy of the page with sample expenses.
Overview
An Advanced Filters card at the top holds a search box and five filters: date range, status, category, payment method and tax deductible. Below it are seven KPI cards and two charts, Monthly Expense Trend and Spending by Category. They all recalculate as soon as you change a filter. Export CSV downloads the expenses that match.
- Rejected expenses never count as spending. They are left out of Total Amount, Average Amount and the charts, but they still count in Total Expenses and Receipt Coverage. They are in the CSV too, where their Counts as spending column says No and the summary at the end of the file repeats the on-screen totals. To drop them from the page, set Status to Counts as spending.
- The page opens on the last 30 days. Clear All goes back to that view: it undoes your search and filters and puts the last 30 days back. To see every expense, open the date button and click All time.
- Plan: the report needs Pro or Premium, or a free trial. On Basic you see an upgrade box over sample data. The Demo button still works. Export CSV needs Premium or a free trial; on Pro it opens an Unlock Premium Features card instead of downloading.
- Access: everyone on your team who can open the page sees every employee's expenses and can export them.
Step by step: analyze spending
- Open Reports → Expenses Report. It starts on the last 30 days.
- Narrow the data. Pick a date range, Status, Category, Payment method or Tax deductible, or type in the search box. To search a different field, first pick Employee Name, Category, Vendor or Description on the left of the box.
- Read the KPI cards and charts. They update straight away.
- Click Export CSV to download the expenses that match.
- To act on what you find (approve, reject or mark reimbursed), go to Finance → Expenses.
What each card counts
| Card | What it shows |
|---|---|
| Total Amount | Sum of Submitted, Approved and Reimbursed expenses. Rejected is left out |
| Total Expenses | Number of matching expenses, Rejected included |
| Average Amount | Total Amount divided by the number of expenses that aren't rejected |
| Pending Approval | How many expenses are Submitted (a count, not dollars) |
| Pending Reimbursements | Dollar total of Approved expenses marked reimbursable — money owed back to the person who paid. A new expense is reimbursable only when Reimbursable was ticked on Create Expense or its import row said Yes. Some older expenses are marked reimbursable although nobody ticked it, so they count here until someone unticks Is Reimbursable. An expense drops out once it is marked Reimbursed, or when Is Reimbursable is unticked — on an Approved expense only the person whose expense it is, or a different owner or Manager, can untick it |
| Tax Deductible | Sum of matching expenses marked Tax Deductible, Rejected left out |
| Receipt Coverage | Share of matching expenses with Has Receipt ticked, Rejected included |
Key features
| Feature | What it does |
|---|---|
| KPI cards | Seven read-only totals (see the table above) |
| Monthly trend | Two lines: spending (Rejected left out) and approved (Approved plus Reimbursed), one point per month of the date range you picked. With the default 30 days that is one month, or two when the range straddles a month end |
| Spending by category | Pie of every category that has spending, sized by dollars. The legend shows category names such as Fuel or Parts |
| Search | Finds text in the employee name, category, vendor or description |
| Filters | Date range, status, category, payment method, tax deductible |
| Refresh | Reloads the latest expenses and keeps your filters |
| Export CSV | Downloads the matching expenses, Rejected included, each marked Yes or No under Counts as spending, and ends with the on-screen totals. Greyed out when nothing matches |
Filters and search
| Control | Options |
|---|---|
| Search | Employee Name (default), Category, Vendor, Description. Partial match, not case-sensitive. Applies half a second after you stop typing, or straight away when you press Enter, and changing the field re-runs the search at once |
| Date range | Filters on each expense's transaction date. Default: last 30 days, which Clear All also goes back to. All time in the calendar removes the range, and the button then says "Transaction date — all time"; Last 30 days puts the opening range back |
| Status | All Statuses, Counts as spending (excludes Rejected), Submitted, Approved, Rejected, Reimbursed |
| Category | All Categories, plus every category your store has used, by name |
| Payment method | All Methods, Cash, Credit Card, Debit Card, Check, Bank Transfer, Digital Wallet, Other |
| Tax deductible | Tax deductible: All, Tax deductible, Not tax deductible |
This page has no receipt, reimbursable or amount filters.
Tips & best practices
- Check Pending Approval to see how many expenses are waiting, then approve them on Finance → Expenses.
- Aim for receipt coverage above 80% to stay audit-ready.
- Pending Reimbursements already shows the total owed back to staff. To list those expenses, set Status to Approved, click Export CSV, and filter the Reimbursable column to Yes in your spreadsheet.
- The trend covers exactly the date range you pick, past years included. For a six-month trend, set a six-month range.
Troubleshooting
| Issue | Fix |
|---|---|
| KPIs show no data | Widen the date range, set Status to All Statuses, or click Clear All. With Status set to Rejected, the money cards show $0 because rejected expenses never count as spending |
| The totals include older expenses than you expected | Check the date button: "Transaction date — all time" means no date range is applied, which is what All time in the calendar leaves behind. Click Clear All or Last 30 days in the calendar, or pick a range |
| Export CSV is greyed out | No expenses match. Loosen the filters |
| A SUM of the CSV's Amount column is higher than Total Amount | The file lists Rejected expenses, which are not spending. Add up only the rows whose Counts as spending column says Yes, or read Total Amount from the summary at the end of the file. To drop them from the page as well, set Status to Counts as spending |
| Pending Reimbursements is high | Mark the paid expenses Reimbursed on Finance → Expenses — an owner or Manager other than the person whose expense it is does that. Some older expenses are marked reimbursable although nobody ticked it, so also untick Is Reimbursable on expenses the company paid directly; on an Approved expense the person whose expense it is can untick it too. A store's only owner can't mark their own expenses Reimbursed: untick Is Reimbursable on them once paid back, or give somebody the Manager role so there is a second reviewer. This page can't change expenses |
| The trend chart looks empty | Nothing matches the filters for those months. The axis follows your date range, so widening the range adds months rather than moving them |
| Sample numbers behind an "Unlock Pro & Premium Features" box | Your store is on Basic. Upgrade in Settings → Billing, or click Demo to explore |
| "403 - Forbidden" | The owner has hidden this page from you. They can turn it back on in Settings → Team |
What's next
- Record more expenses: Finance → Expenses
- See the impact on profit: Reports → Profit & Loss
- Prepare for tax time: Income Tax Prep
- Review supplier spend: Inventory → Vendors
Detailed reference
Every button, icon, field and message on this page, for when you need the exact detail. Each panel starts closed — open the one you need.
Page header and toolbar
| Control | Where | What it does | Notes |
|---|---|---|---|
| Reports → Expenses Report (receipt icon) | Sidebar, Reports group | Opens this page | Hover text "View detailed expenses report." A small Pro tag shows beside it when your store is on Basic with no trial. No tag on Pro, Premium or during a trial |
| Open Expenses report | Income Tax Prep page, card Deductible expenses | Opens this page | — |
| Title Expenses Report, "Track and analyze business expenses, monitor spending patterns, and see what is still owed back to staff." | Header | — | Nothing on this page changes an expense. Mark expenses reimbursed on Finance → Expenses |
| Demo (Play icon, amber) | Header, right | Opens the demo copy of this page with sample expenses. The guided tour starts by itself the first time | Everyone. Still clickable while the Basic-plan upgrade box is showing. See the Demo mode panel below and Demo mode |
| Page layout | — | One view: the Advanced Filters card, seven KPI cards and two charts | No tabs, no list of expenses, and no dialogs apart from the date calendar and, on Basic, the upgrade box |
Section: Advanced Filters
Every change applies straight away. There is no Apply button. The cards and charts recalculate from the matching expenses.
| Control | Where | What it does | Notes |
|---|---|---|---|
| Advanced Filters (funnel icon) | Card title, left | Label | — |
| Search-field selector: 👤 Employee Name, 📂 Category, 🏪 Vendor, 📝 Description | Top row, left part of the search box | Chooses which field the search text is matched against | Default Employee Name. Picking a field re-runs the text that's in the box against it at once. It always shows the field the results are using, so Clear All puts it back to Employee Name with them |
| Search box (placeholder "Search by employee name...", "Search by category...", "Search by vendor..." or "Search by description...") | Top row, middle | Keeps expenses whose chosen field contains the text | Partial match, not case-sensitive. Applies half a second after you stop typing. A category search matches either the name on screen or the code behind it, so "fuel" and "gas" both find fuel expenses. An expense with that field empty never matches |
| Enter key | In the search box | Applies the search straight away | — |
| Magnifier icon (no label) | Right end of the search box | Applies the search straight away | Always clickable |
| Refresh (circular arrows) | Top right, 1st | Reloads your store's expenses. The whole page shows "Loading expenses data..." until it finishes | Filters and search are kept |
| Export CSV (download icon) | Top right, 2nd | Premium or a free trial: downloads the matching expenses as a CSV file straight away, with no message. Pro: opens Unlock Premium Features and downloads nothing | Greyed out when no expenses match. File details are in the table below |
| Clear All (X icon) | Top right, 3rd | Clears the search text, sets Status, Category, Payment method and Tax deductible back to All, and puts the date range back to the last 30 days — the view the page opens on | Only shown while something differs from that view: a search, a filter, or a date range other than the last 30 days (All time included). Not shown when the page first opens. For every expense, use All time in the calendar |
| Date-range button (calendar icon) | Second row, 1st | Opens the date calendar (see Dialog: Date range calendar). Filters on each expense's transaction date, not the date it was submitted | Default: 30 days ago to today. Reads like "Aug 19 - Sep 18, 2026". With only a start date: "Aug 19, 2026 - ...". With no range: grey "Transaction date — all time", which is what the page then covers. Whole days, both ends included |
| Status: All Statuses, 💵 Counts as spending (excludes Rejected), 📝 Submitted, ✅ Approved, ❌ Rejected, 💰 Reimbursed | Second row, 2nd | Keeps one status, or with Counts as spending every status the money figures count — Submitted, Approved and Reimbursed | Default All Statuses. With Rejected, Total Amount and Average Amount show $0 and the pie is blank, because rejected expenses never count as spending. Total Expenses and Receipt Coverage still count them. Counts as spending makes the count and the money agree, and shows as the chip "Status: Counts as spending" |
| Category: All Categories, then 📂 plus each category name | Second row, 3rd | Keeps one category | Default All Categories. Listed A to Z by name, from all your store's expenses (any date) — Fuel, Office Supplies, Parts. A category the app has no name for is listed as it is stored. A category can have no expenses in the current date range |
| Payment method: All Methods, 💵 Cash, 💳 Credit Card, 💳 Debit Card, 📄 Check, 🏦 Bank Transfer, 📱 Digital Wallet, 🔧 Other | Second row, 4th | Keeps one payment method | Default All Methods |
| Tax deductible: All, 🧾 Tax deductible, 🚫 Not tax deductible | Second row, 5th | Keeps only expenses marked tax-deductible, or only those that aren't | Default Tax deductible: All. New and imported expenses are marked tax-deductible unless someone said otherwise, so Not tax deductible usually lists the exceptions. Every card, chart and the CSV follow the choice |
| Filter chips "Status: …", "Category: …", "Payment: …", "Tax deductible: Yes/No", "Dates: …", "Search: "…"" | Under the filters | Show which filters are on | Not clickable. Change them with the dropdowns, the date button or Clear All. The date chip is always there and names the period: "Dates: Aug 19, 2026 - Sep 18, 2026", "from …"/"up to …" when only one end is set, or "Dates: all time". The category and payment chips use the same words as the dropdowns, such as "Category: Fuel" and "Payment: Credit Card" |
There is no receipt, reimbursable or amount filter. For receipts and reimbursable, export the CSV and filter the Has Receipt or Reimbursable column in your spreadsheet.
Export CSV file:
| Detail | Value |
|---|---|
| File name | expenses-report-YYYY-MM-DD-HHmm.csv, using your computer's date and time |
| Rows | The expenses that match your filters, newest transaction date first. With Status on All Statuses this includes Rejected expenses |
| Columns | Transaction Date, Employee, Category, Description, Vendor, Amount, Currency, Payment Method, Status, Has Receipt, Reimbursable, Tax Deductible, Counts as spending |
| Formats | Dates as YYYY-MM-DD. Category and Payment Method in the same words as the page (Fuel, Credit Card), so the file and the screen agree; a code the app has no name for is written as it is stored. Amount as a plain number with no $ sign or commas, and no trailing zeros (85.5, 245). Currency as recorded, or USD when blank. Status as Submitted, Approved, Rejected or Reimbursed. Has Receipt, Reimbursable, Tax Deductible and Counts as spending as Yes or No |
| Spreadsheet safety | Every cell is in double quotes. A cell that starts with =, +, - or @ gets an apostrophe in front so spreadsheets don't read it as a formula. A negative amount such as -25 therefore shows as '-25 |
| Summary at the end | After the last expense: a blank line, then "Summary", Total Amount, Total Expenses, Average Amount, Tax Deductible Amount, Rows not counted as spending and Amount not counted as spending. These are the figures on the cards, so the file can be tied to the page |
| Empty file | Never produced: the button is greyed out when nothing matches |
Section: KPI cards
Seven read-only cards. They aren't clickable and have no tooltips, sub-text or trend arrows. Submitted, Approved and Reimbursed expenses count as spending. Rejected never adds to a money total.
| Control | Where | What it does | Notes |
|---|---|---|---|
| Total Amount (dollar icon, cyan) | Cards, 1st | Sum of the matching expenses that count as spending | US dollars with cents, such as "$3,292.57". "$0" when nothing counts. Amounts are added as recorded, whatever currency they were entered in |
| Total Expenses (receipt icon, green) | Cards, 2nd | Number of matching expenses, Rejected included | "0" when nothing matches |
| Average Amount (upward-trend icon, orange) | Cards, 3rd | Total Amount divided by the number of matching expenses that aren't rejected | US dollars with cents, such as "$1,234.56". "$0" when nothing counts |
| Pending Approval (alert-circle icon, purple) | Cards, 4th | How many matching expenses are Submitted | A count, not dollars |
| Pending Reimbursements (check-circle icon, blue) | Cards, 5th | Dollar total of matching Approved expenses with Is Reimbursable ticked | Submitted expenses aren't included until approved. New expenses start with Reimbursable unticked on Create Expense, and an import row is reimbursable only when its Reimbursable column says Yes. Some older expenses have Is Reimbursable ticked although nobody chose it, and count here until someone unticks it. An expense drops out once marked Reimbursed or unticked. US dollars with cents, such as "$1,234.56". "$0" when none |
| Tax Deductible (bank icon, pink) | Cards, 6th | Dollar total of matching expenses marked Tax Deductible, with Rejected claims left out | New and imported expenses are marked tax-deductible unless someone said otherwise. Set the flag on Finance → Expenses; this page only reads it. "$0" when none |
| Receipt Coverage (document icon, cyan) | Cards, 7th | Percent of matching expenses with Has Receipt ticked, to one decimal | Has Receipt is ticked when a receipt file is attached, or by hand when editing the expense. Rejected expenses count. "0%" when nothing matches |
Section: Charts
| Control | Where | What it does | Notes |
|---|---|---|---|
| Monthly Expense Trend (line chart) | Left chart | Two lines per month: Total Expenses ($) (purple) is spending with Rejected left out. Approved ($) (green) is Approved plus Reimbursed | The bottom axis is every month of the date range you picked, oldest first, with short month names — and the year as well ("Jun '25") once the range crosses a calendar year. A range of more than 36 months draws only its most recent 36, with "Showing the last 36 months of the selected date range." underneath. With All time (no date range at all) the axis runs from your oldest expense to your newest, month by month, again at most the most recent 36. Months you spent nothing in are still drawn, at zero |
| Hover on a month | Trend chart | Shows the month and both values | In dollars to the cent, such as "$1,234.56". The side axis is in short dollars ("$1.2K") |
| Legend | Under the trend chart | Colour key | Clicking does nothing |
| Spending by Category (pie) | Right chart | One slice per category that has spending, sized by dollars | Every such category shows, not only the top ones. Slices have no labels; the legend and hover show category names. Rejected is left out. Every slice has its own colour, however many categories there are |
| Hover on a slice | Pie | Shows the category name and amount | In dollars to the cent |
| Legend | Under the pie | Colour key with the category names | Clicking does nothing |
| Blank pie | Right chart | Empty card with no message | When nothing matches, or only Rejected expenses match |
Dialog: Date range calendar
Opened by the date-range button. Each click applies straight away. There is no OK button.
| Control | Where | What it does | Notes |
|---|---|---|---|
| Last 30 days | Calendar, top right, above the months | Sets the range the report opens on: 30 days ago to today | The same range Clear All goes back to. The way back after All time, or after clearing the range in the calendar, without reloading the page |
| All time | Calendar, top right, beside Last 30 days | Removes the date range, so the report covers every expense | The button then shows grey "Transaction date — all time", and the chip "Dates: all time". The Monthly Expense Trend runs from your oldest expense to your newest, up to 36 months |
| Two-month calendar | Under the date button | Pick the start and end days | Opens on the start date's month, or this month when no range is set. Stays open after you click. Close it by clicking outside or pressing Esc |
| Left and right arrows | Calendar, top | Previous or next month | — |
| Click a day, no range set | Calendar | Sets the start date only. The report then covers that day onwards, including today and any future-dated expenses | The button reads like "Aug 19, 2026 - ..." |
| Click a day, only a start set | Calendar | A day on or after the start sets the end. A day before the start becomes the new start, and the old start becomes the end | — |
| Click a day before the start, full range set | Calendar | Moves the start to that day | — |
| Click a day after the start, full range set | Calendar | Moves the end to that day | — |
| Click the end day | Calendar | Makes it the new start, with no end | The report then covers that day onwards |
| Click the start day | Calendar | Clears the range. The report then covers all time | The button shows grey "Transaction date — all time" |
| Keyboard | Calendar | Arrow keys move between days. Enter or Space picks the highlighted day, following the click rules above | The calendar takes the keyboard focus when it opens |
Dialog: Upgrade box (Basic plan)
Shown on the Basic plan when there is no trial. Pro, Premium and trials see the real report. Behind the box the page shows sample expenses (the same ones as the demo), not your store's numbers. Nothing behind the box can be clicked except Demo.
| Control | Where | What it does | Notes |
|---|---|---|---|
| Lock icon, Unlock Pro & Premium Features, "SMS, insights, finance tools & more" | Box header | — | — |
| Check Details (green) | Box header, right | Opens Settings → Billing | The box header's only button |
| Pro list: "500 SMS/month + a dedicated phone #", "SMS campaigns & review invites", "Ads-vs-store insights", "Finance: expenses, assets, reports", "Customer Portal: tracking, payments, scheduling" | Box body, left | Read-only | This report is part of "Finance: expenses, assets, reports" |
| Premium list: "Everything in Pro", "2,000 SMS/month", "Advanced reporting (grouped/pivot)", "CSV / PDF data export", "Workforce: time clock, timesheets, pay runs" | Box body, right | Read-only | This report's Export CSV is one of those Premium exports |
| Demo | Page header, right | Opens the demo | Stays clickable above the box |
Dialog: Unlock Premium Features
Opens when a store below Premium, and outside a free trial, clicks Export CSV. Nothing is downloaded. It is a small card in the middle of a dimmed page.
| Control | Where | What it does | Notes |
|---|---|---|---|
| Lock icon, Unlock Premium Features, "Advanced reporting & data export" | Card header | — | — |
| Check Details (green) | Card header, right | Closes the card and opens Settings → Billing | — |
| Premium chip and list: "Everything in Pro", "2,000 SMS/month", "Advanced reporting (grouped/pivot)", "CSV / PDF data export" | Card body | What the plan adds | Read-only |
| X (header, right of Check Details), the Esc key, or a click on the dimmed area outside the card | Header or anywhere outside | Closes the card. Nothing is downloaded | — |
Messages you may see
| Message | When it appears | What to do |
|---|---|---|
| "Loading..." (plain text) | For a moment when you open the page, while the app checks you're allowed to see it | Wait |
| "Loading expenses data..." (spinner) | While the page loads, and after Refresh | Wait. The most recent 10,000 expenses load, in batches |
| "Authentication Required", "User data not found. Please login again.", with a Go to Login button | The app couldn't identify you or your store | Click Go to Login and sign in; you come back to this report |
| "Authentication Required", "Please login to access this feature.", with Go to Login | Your sign-in session couldn't be verified | Same as above |
| "Authentication Required", "Invalid user data. Please login again.", with Go to Login | Any other problem identifying you | Same as above |
| "Error loading expenses data" with the server's message, or "Failed to load expenses data" | Your expenses couldn't be loaded | Reload the page. If it keeps happening, contact support with the exact text |
| "403 - Forbidden", "You do not have permission to view this page. Contact your organization owner." | The owner has hidden Expenses Report from your menu (stores with more than one active person) | Ask the owner to show it again in Settings → Team |
| Grey "Transaction date — all time" on the date button | No date range is set, after All time in the calendar or after clicking the start day | Nothing to fix: that is what the page is showing. For the opening range, click Clear All, or open the button and click Last 30 days |
| "Search by employee name...", "Search by category...", "Search by vendor...", "Search by description..." | Search box placeholder, by selected field | — |
| Chips "Status: …", "Category: …", "Payment: …", "Tax deductible: Yes/No", "Dates: …", "Search: "…"" | Filters are on (the Dates chip is always there) | Change them in the dropdowns, or use Clear All |
| Unlock Pro & Premium Features box over sample data | Basic plan with no trial | Upgrade in Settings → Billing, or click Demo |
| "$0", "0", "0%", flat lines and a blank pie | Nothing matches, or only Rejected expenses match | Widen the dates, set Status to All Statuses, or click Clear All |
| Export CSV greyed out | No expenses match | Loosen the filters |
| No message after Export CSV | Normal: the file downloads silently | Check your browser's downloads |
| "Demo mode — expenses are populated with sample data. All actions are disabled." | Demo page | Click Exit Demo Mode to return |
Who can use what
| Who | What they get |
|---|---|
| Pro | The full report. Export CSV opens Unlock Premium Features instead of downloading |
| Premium or a free trial | The full report, including Export CSV |
| Basic with no trial | The upgrade box over sample data. Only Demo works. A Pro tag shows beside the sidebar item |
| Plan still loading or can't be determined | The full report |
| Owner, managers and staff | The same page, with no role differences. Everyone who can open it sees every employee's expenses for the store and can export them |
| A team member the owner hid the item from | The "403 - Forbidden" page. Owners show or hide menu items per person in Settings → Team. Nothing is blocked while the store has only one active person: people switched off or removed in Team don't count |
| How much data | The most recent 10,000 expenses by transaction date |
Demo mode (/finance/expenses-report/demo)
- Open it: Demo (Play icon, amber) at the right of the page header. Works on every plan, including Basic.
- Header: "Expenses Report — Demo", "Sample expenses populated with demo data. All actions are disabled.", with Exit Demo Mode (back arrow) on the right.
- Banner: "Demo mode — expenses are populated with sample data. All actions are disabled." (eye icon), with Take a Tour (question-mark icon) to restart the tour at step 1.
- Still works: the live page's whole filter bar — search-field selector, search box, date range (with Last 30 days and All time), Status (including Counts as spending), Category, Payment method, Tax deductible and Clear All — and hovering over the charts. The chips, the cards, the trend and the pie follow the filters exactly as on the live page.
- Disabled: Refresh and Export CSV are always greyed out. The cards and charts are display only.
- Leave: Exit Demo Mode returns to the live report, or use any sidebar link.
The guided tour starts by itself the first time the demo opens.
| # | Tab | Tour step | What it points at |
|---|---|---|---|
| 1 | None (one view) | Advanced Filters: "Search and filter expenses by employee name, category, vendor, or description. On your live report, Refresh reloads the expenses and Export CSV downloads the ones on screen; both are off in this demo." | The Advanced Filters card |
| 2 | None (one view) | Filter Dropdowns: "Use these quick filters to narrow expenses by date range, status (Submitted, Approved, Rejected, Reimbursed, or everything that counts as spending), category, payment method, and whether an expense is tax deductible. Try clicking them to explore!" | The row with date range, Status, Category, Payment method and Tax deductible |
| 3 | None (one view) | Key Metrics: "At-a-glance metrics showing total amount, expense count, average per expense, pending approvals, pending reimbursements, tax-deductible spend, and receipt coverage percentage." | The seven stat cards |
| 4 | None (one view) | Monthly Expense Trend: "Line chart showing your total expenses and approved amounts for every month of the date range you picked. Track spending patterns and identify trends." | The trend chart |
| 5 | None (one view) | Spending by Category: "Pie chart breaking down your spending by category. Quickly see where the most money is being spent across Fuel, Travel, Tools, Meals, and more." | The pie chart |
Tour controls: progress dots and an "… of 5" counter, Back (from step 2), Skip, and Next (Got it! on step 5). Clicking the dark area outside closes the tour. Keys: Esc closes it from anywhere, the right arrow or Enter moves forward (Enter on the last step closes it), and the left arrow goes back. Enter typed in the search box searches, and leaves the tour where it is; the same goes for Enter on a button you have focused, while the arrows keep working after you click Next with the mouse. Once you have closed the tour your browser remembers, so it doesn't open by itself the next time you come back — Take a Tour replays it from step 1.
Sample data: 15 expenses dated 1 to 60 days ago, from John Smith, Sarah Johnson and Mike Davis. None is Rejected, and none is both Approved and reimbursable. With the default 30 days the cards read: Total Amount $3,292.57, Total Expenses 12, Average Amount $274.38, Pending Approval 2, Pending Reimbursements $0, Tax Deductible $1,483.57, Receipt Coverage 75.0%. The Category list holds the 7 categories the sample uses, sorted by the name shown: Fuel, Meals, Office Supplies, Other, Parts, Tools, Travel.
Differences from the live page:
- Refresh and Export CSV are always disabled.
- There is no plan lock.
- The numbers are the sample expenses above, not your store's.
Common questions
Why is Total Amount lower than the total in my CSV? With Status on All Statuses, the CSV lists every matching expense, Rejected ones included, and Total Amount leaves Rejected out. The file reconciles itself: each row has a Counts as spending column of Yes or No, and a summary block at the end repeats the on-screen figures, Total Amount among them. Add up only the Yes rows, or read the summary. To drop Rejected from the page too, set Status to Counts as spending (excludes Rejected).
I clicked Clear All and the dates changed. Why? Clear All puts the report back the way it opens: no search, every filter on All, and the last 30 days. If you had picked other dates, they go too. To see every expense instead, open the date button and click All time.
How do I see which expenses we still owe employees? Pending Reimbursements shows the dollar total of Approved expenses marked reimbursable. New expenses are reimbursable only when someone ticks Reimbursable on Create Expense or says Yes in the import file. Some older expenses are marked reimbursable although nobody ticked it, so untick Is Reimbursable on Finance → Expenses for anything the company paid directly. On an Approved expense that is done by the person whose expense it is, or by a different owner or Manager. There is no reimbursable filter here. To list them, set Status to Approved, click Export CSV, and filter the Reimbursable column to Yes. Once you mark them Reimbursed on Finance → Expenses, they drop out of the card.
Can I approve, edit or delete expenses on this page? No. The report is read-only and has no list of expenses. Use Finance → Expenses.
Why is the Monthly Expense Trend almost empty? It draws one point per month of your date range, and the default range is 30 days — so one or two points. Set a longer date range and the axis grows to match it. A range in a past year draws that year's months, not this year's.
Why do I see sample numbers behind an "Unlock Pro & Premium Features" box? Your store is on Basic with no trial. The numbers behind the box are sample data, not yours. Upgrade in Settings → Billing, or click Demo to explore with the guided tour.
Can I see only tax-deductible expenses here? Yes. Set Tax deductible to Tax deductible in the filter bar. Every card, both charts and the CSV then cover only those expenses, and the Tax Deductible card shows their total whatever the filter is set to. The CSV also has a Tax Deductible column. New and imported expenses are marked tax-deductible unless someone said otherwise; change an expense on Finance → Expenses.
Why can't I find "Fuel" in the Category list? You can. Categories are listed, searched and charted by name — Fuel, Office Supplies, Parts — and a category search matches the code behind the name too, so "fuel" and "gas" both work. A category the app has no name for is shown exactly as it is stored.
Can staff see other employees' expenses here? Yes. Everyone who can open the page sees all of the store's expenses and can export them. The owner can hide the page from a team member in Settings → Team.