Profit & Loss
The Profit & Loss statement shows whether you're making money: revenue, cost of goods sold, operating expenses, and net income — with period comparisons and margin KPIs.
Overview
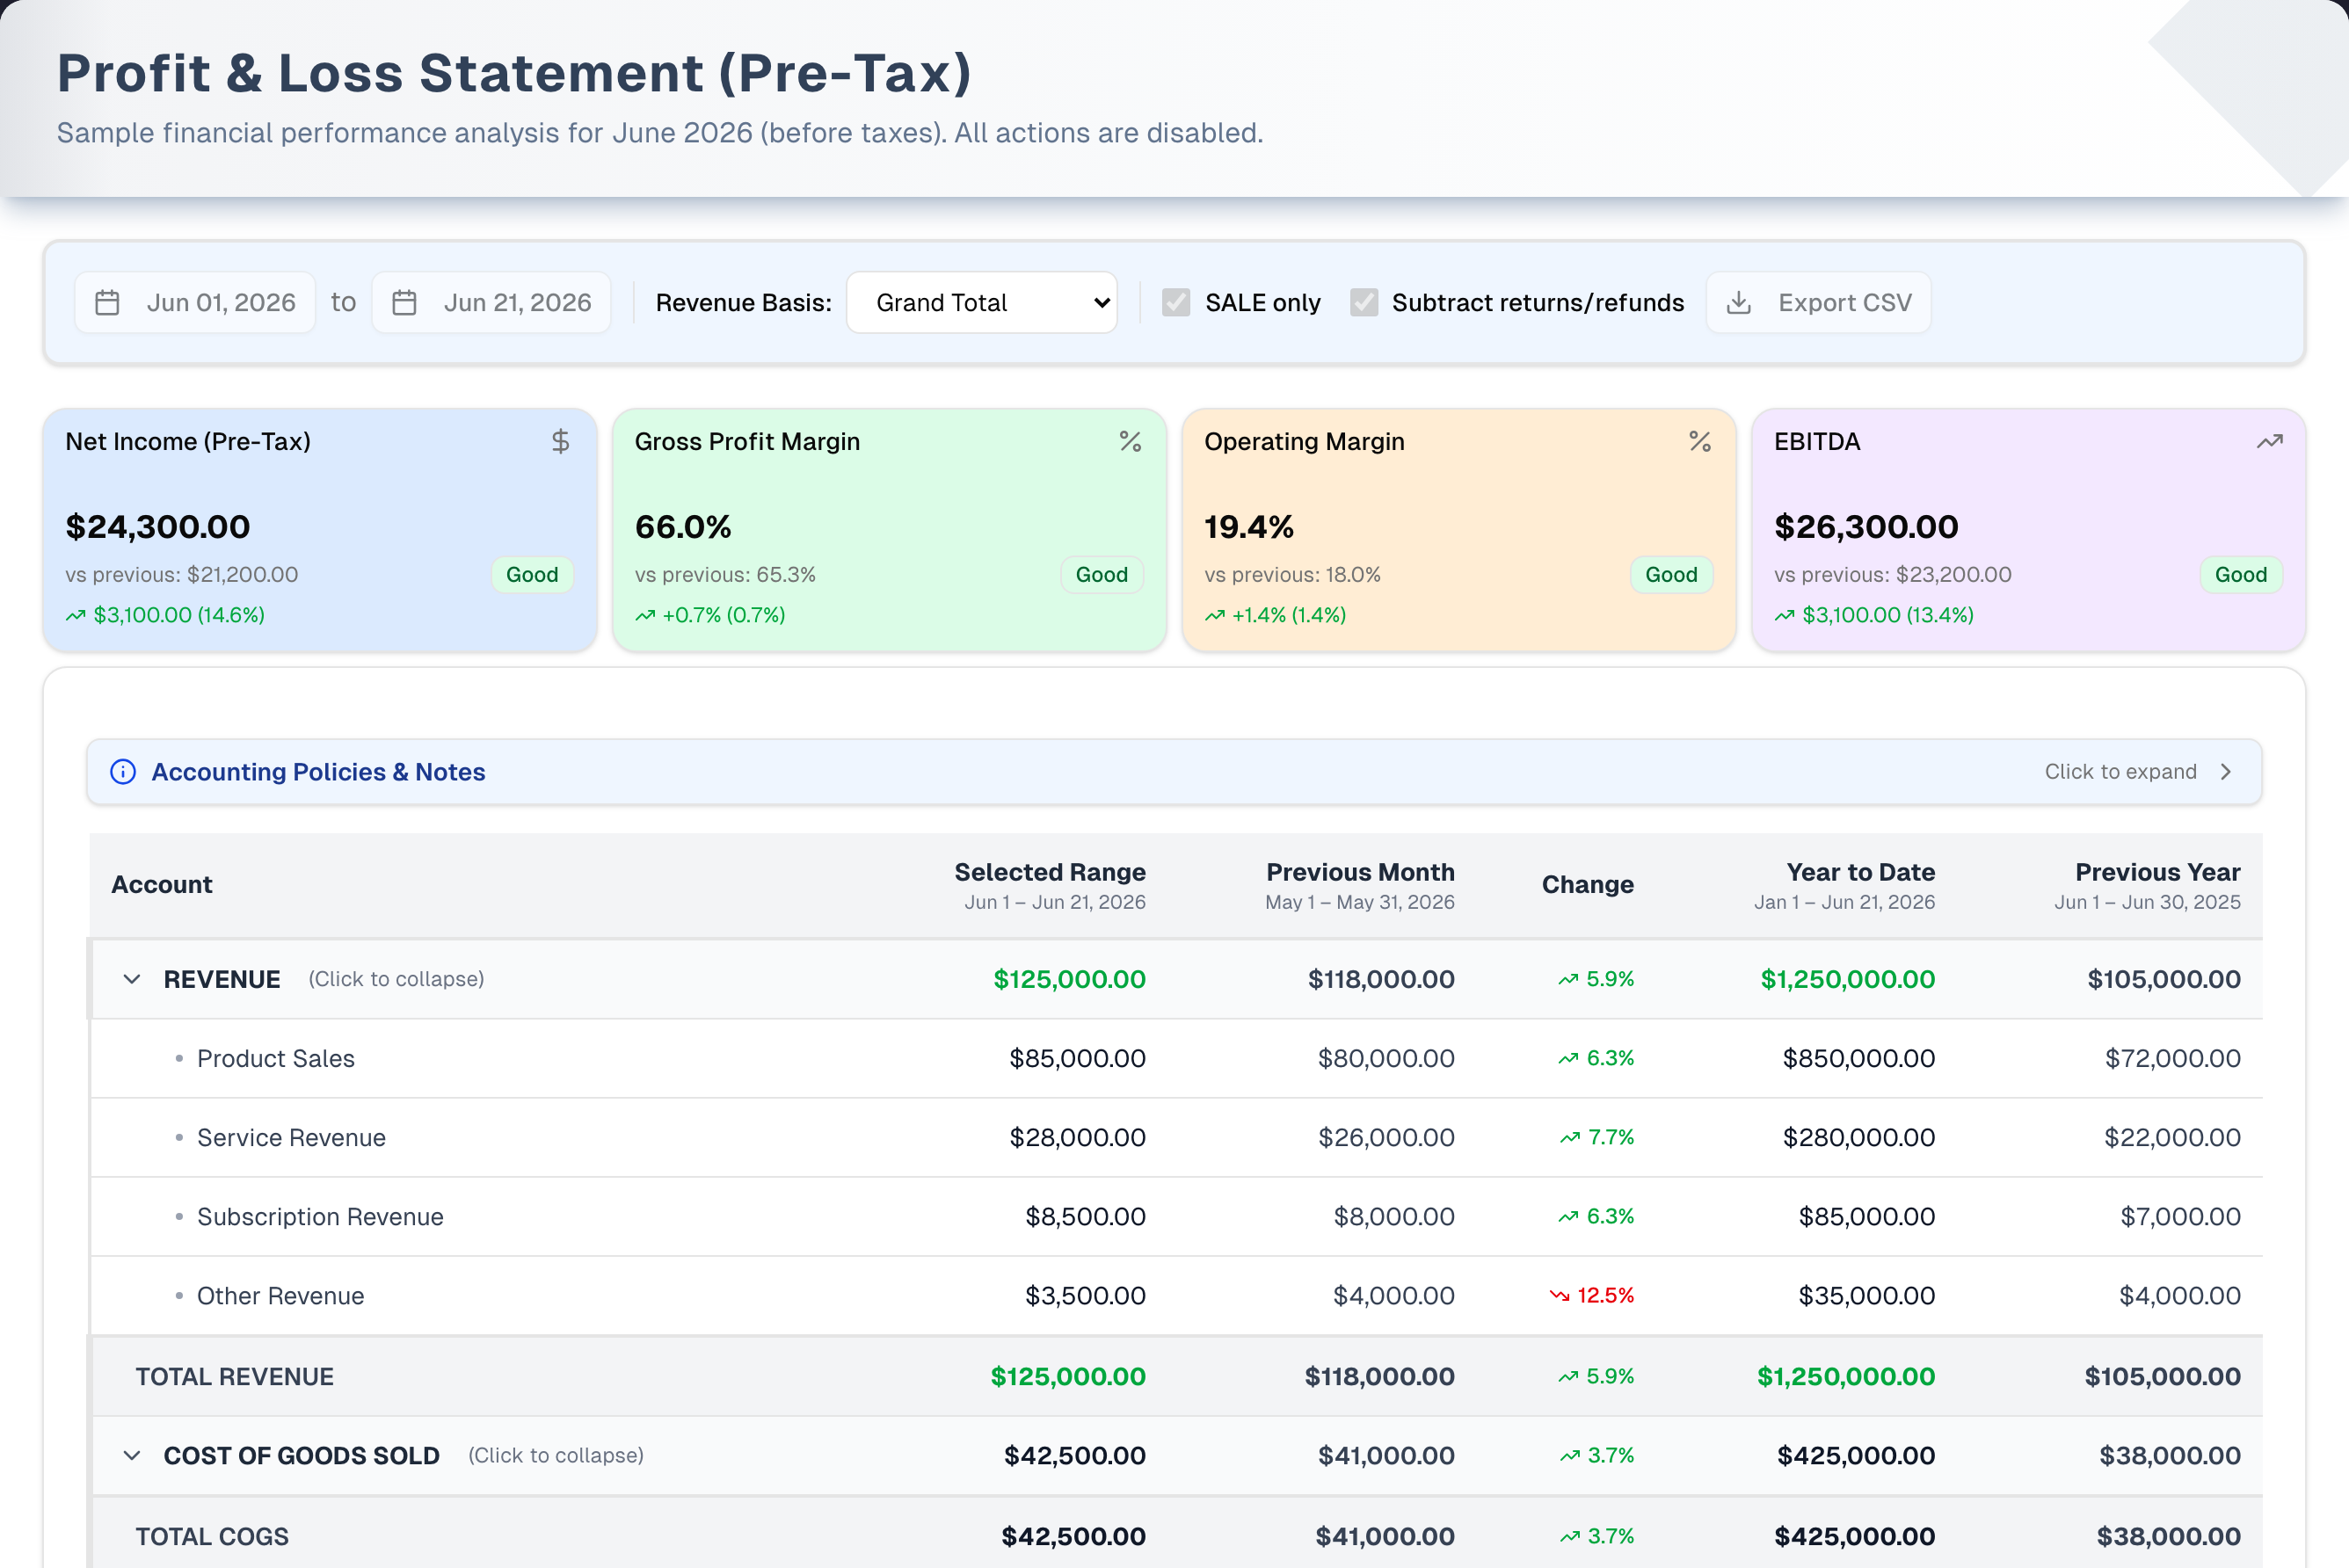
Four KPI cards (Net Income, Gross Profit Margin, Operating Margin, EBITDA) sit above a hierarchical statement: Revenue → Total Revenue → COGS → Gross Profit → Operating Expenses → Operating Income → Net Income. Columns compare the selected range to the previous month, year-to-date, and the previous year. Filters control the revenue basis and whether returns are subtracted.
Step by step: run a P&L
- Set the date range (start/end pickers) for your analysis period.
- Toggle SALE only and Subtract returns/refunds to match your accounting policy.
- Expand/collapse the Revenue, COGS, and OPEX sections to read line items.
- Compare the KPI cards and the Change % column to the prior period.
Key features
| Feature | What it does |
|---|---|
| KPI cards | Net Income, Gross Profit Margin, Operating Margin, EBITDA — each with a trend |
| Hierarchical statement | Revenue, COGS, OPEX, and calculated totals with color-coded borders |
| Period columns | Selected range, previous month, year-to-date, previous year |
| Accounting policies note | Explains revenue, COGS, and expense recognition |
| Export CSV | Download the statement (Premium) |
Tabs, views & filters
| Control | Options |
|---|---|
| Date range | Custom start/end (defaults to current month) |
| Revenue basis | Grand Total (net of tax) · Net of Discounts |
| Toggles | SALE only · Subtract returns/refunds |
Tips & best practices
- Compare Gross Profit Margin month over month to catch COGS creep.
- Expand OPEX to find your largest cost relative to revenue.
- Use a quarterly or YTD range for planning conversations.
- Net income flows into your balance sheet: it appears as Retained Earnings on Reports → Assets & Liabilities, so the two statements reconcile.
- New to the P&L? Click the amber Demo button in the page header for a guided tour with sample data.
Troubleshooting
| Issue | Fix |
|---|---|
| Net Income is $0 | Confirm SALE orders are realized (Completed/Delivered/Shipped), not drafts |
| COGS is $0 | Products lack cost data — assign costs and ensure POs exist |
| Export blocked | CSV export is a Premium feature |
| Margin looks wrong | Check the revenue basis (tax-inclusive vs. net) |
What's next
- Drill into revenue: Reports → Sales Report
- Review spending: Reports → Expenses Report
- Check financial position: Reports → Assets & Liabilities