Sales Report
The Sales Report analyzes realized revenue — completed orders only — with trends, average order value, top sellers, and conversion and return rates.
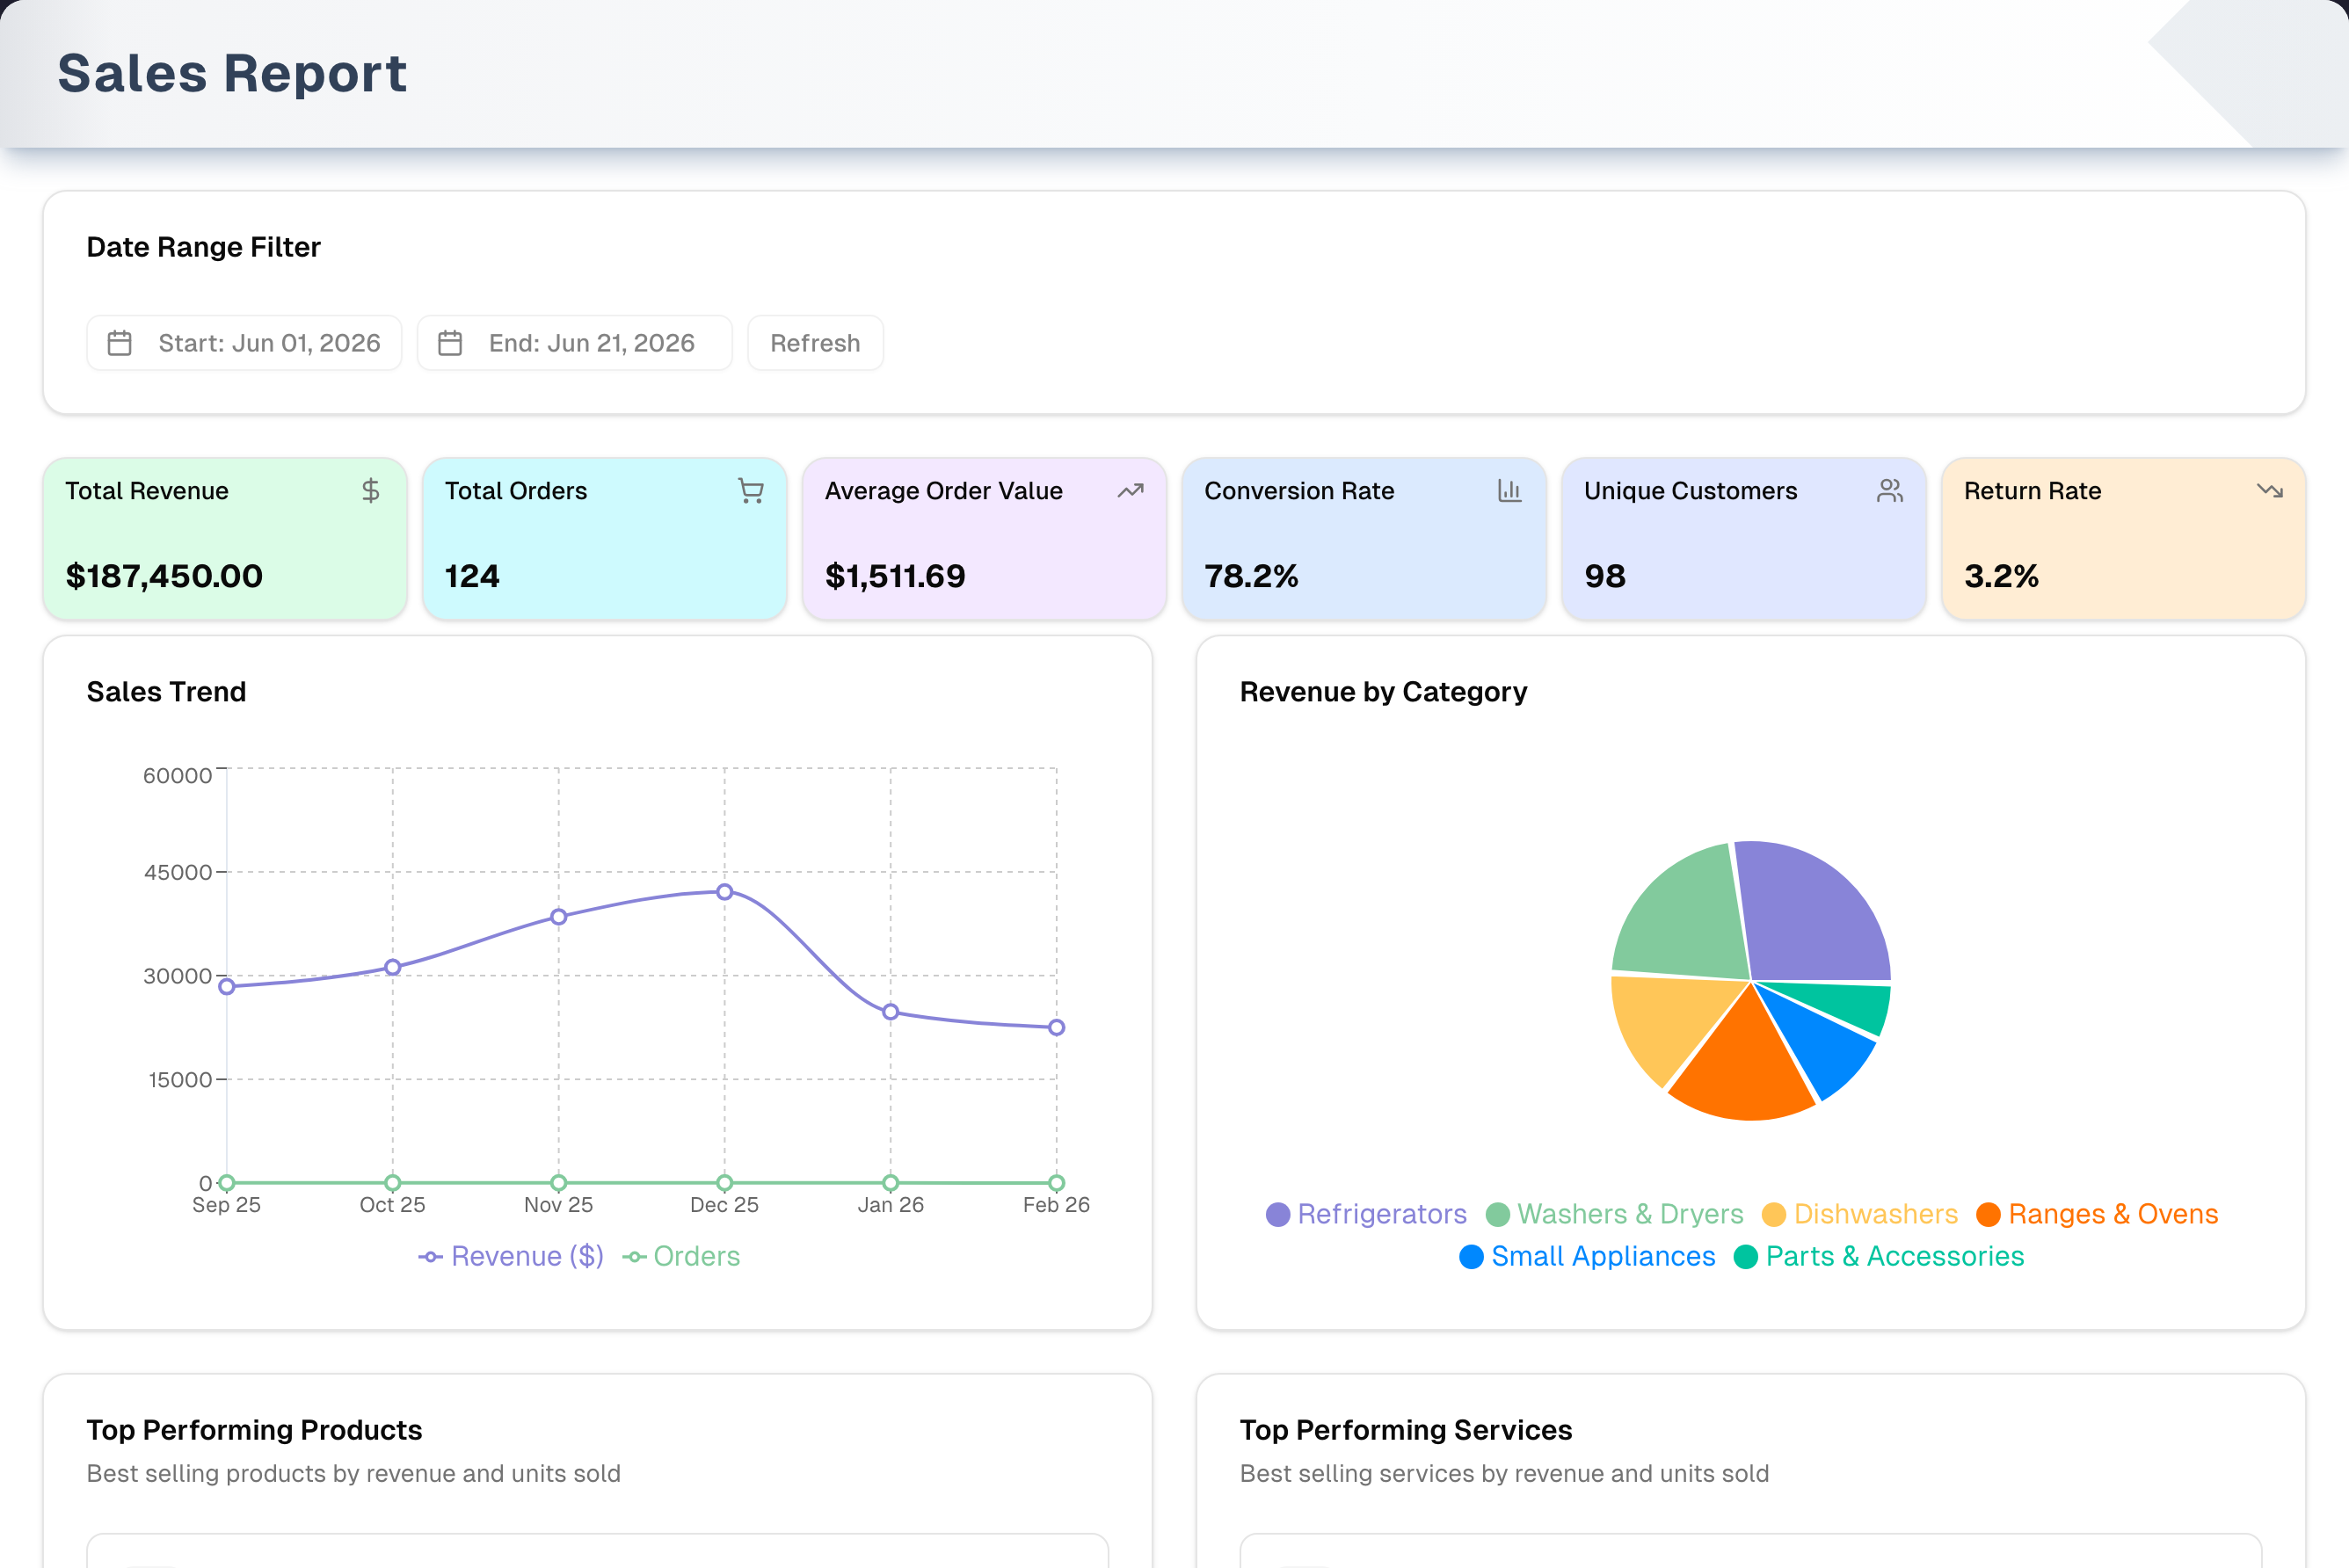
Overview
Six KPI cards (Total Revenue, Total Orders, Average Order Value, Conversion Rate, Unique Customers, Return Rate) sit above a sales-trend line chart, a revenue-by-category pie, and top-performing product and service tables. A date-range filter scopes everything; all figures use realized SALE orders.
Step by step: analyze sales
- Set the date range (start/end pickers) and click Refresh.
- Read the KPI cards for revenue, order count, conversion, and return rate.
- Scan the trend chart for momentum and the top product/service tables for best sellers.
Key features
| Feature | What it does |
|---|---|
| KPI cards | Total Revenue, Orders, Avg Order Value, Conversion Rate, Unique Customers, Return Rate |
| Sales trend | Revenue and order volume over recent months |
| Revenue by category | Top categories' share of revenue |
| Top products | Top 5 by revenue with units sold |
| Top services | Top 5 services by revenue with units sold |
| Date range filter | Scope the whole report; Refresh to reload |
Tabs, views & filters
| Control | Options |
|---|---|
| Date range | Custom start/end (defaults to current month) |
| Refresh | Reloads all data for the range |
Tips & best practices
- Run weekly, monthly, and quarterly ranges to compare momentum.
- Watch Conversion Rate — a sudden drop can flag sales or operational issues.
- Use top products/services to guide inventory and promotions.
Troubleshooting
| Issue | Fix |
|---|---|
| KPIs show $0 | No realized SALE orders in range — widen it; drafts/cancelled don't count |
| High return rate (>5%) | Isolate the period and investigate root causes |
| Orders = 0 but revenue > $0 | Check order statuses (Completed/Delivered/Shipped) |
What's next
- Create more sales: Sales → New
- Check profitability: Reports → Profit & Loss
- Reward top customers: Growth → Loyalty Program