Assets & Liabilities
The Assets & Liabilities Report is your formal balance sheet. It shows total assets, liabilities and equity as of the last day of a month you pick, next to the month before and the same month last year, with a debt-to-equity ratio. Open it from Reports → Assets & Liabilities in the sidebar. Every balance is cumulative from your first journal entry, and the report is read-only: nothing you do here changes your books.
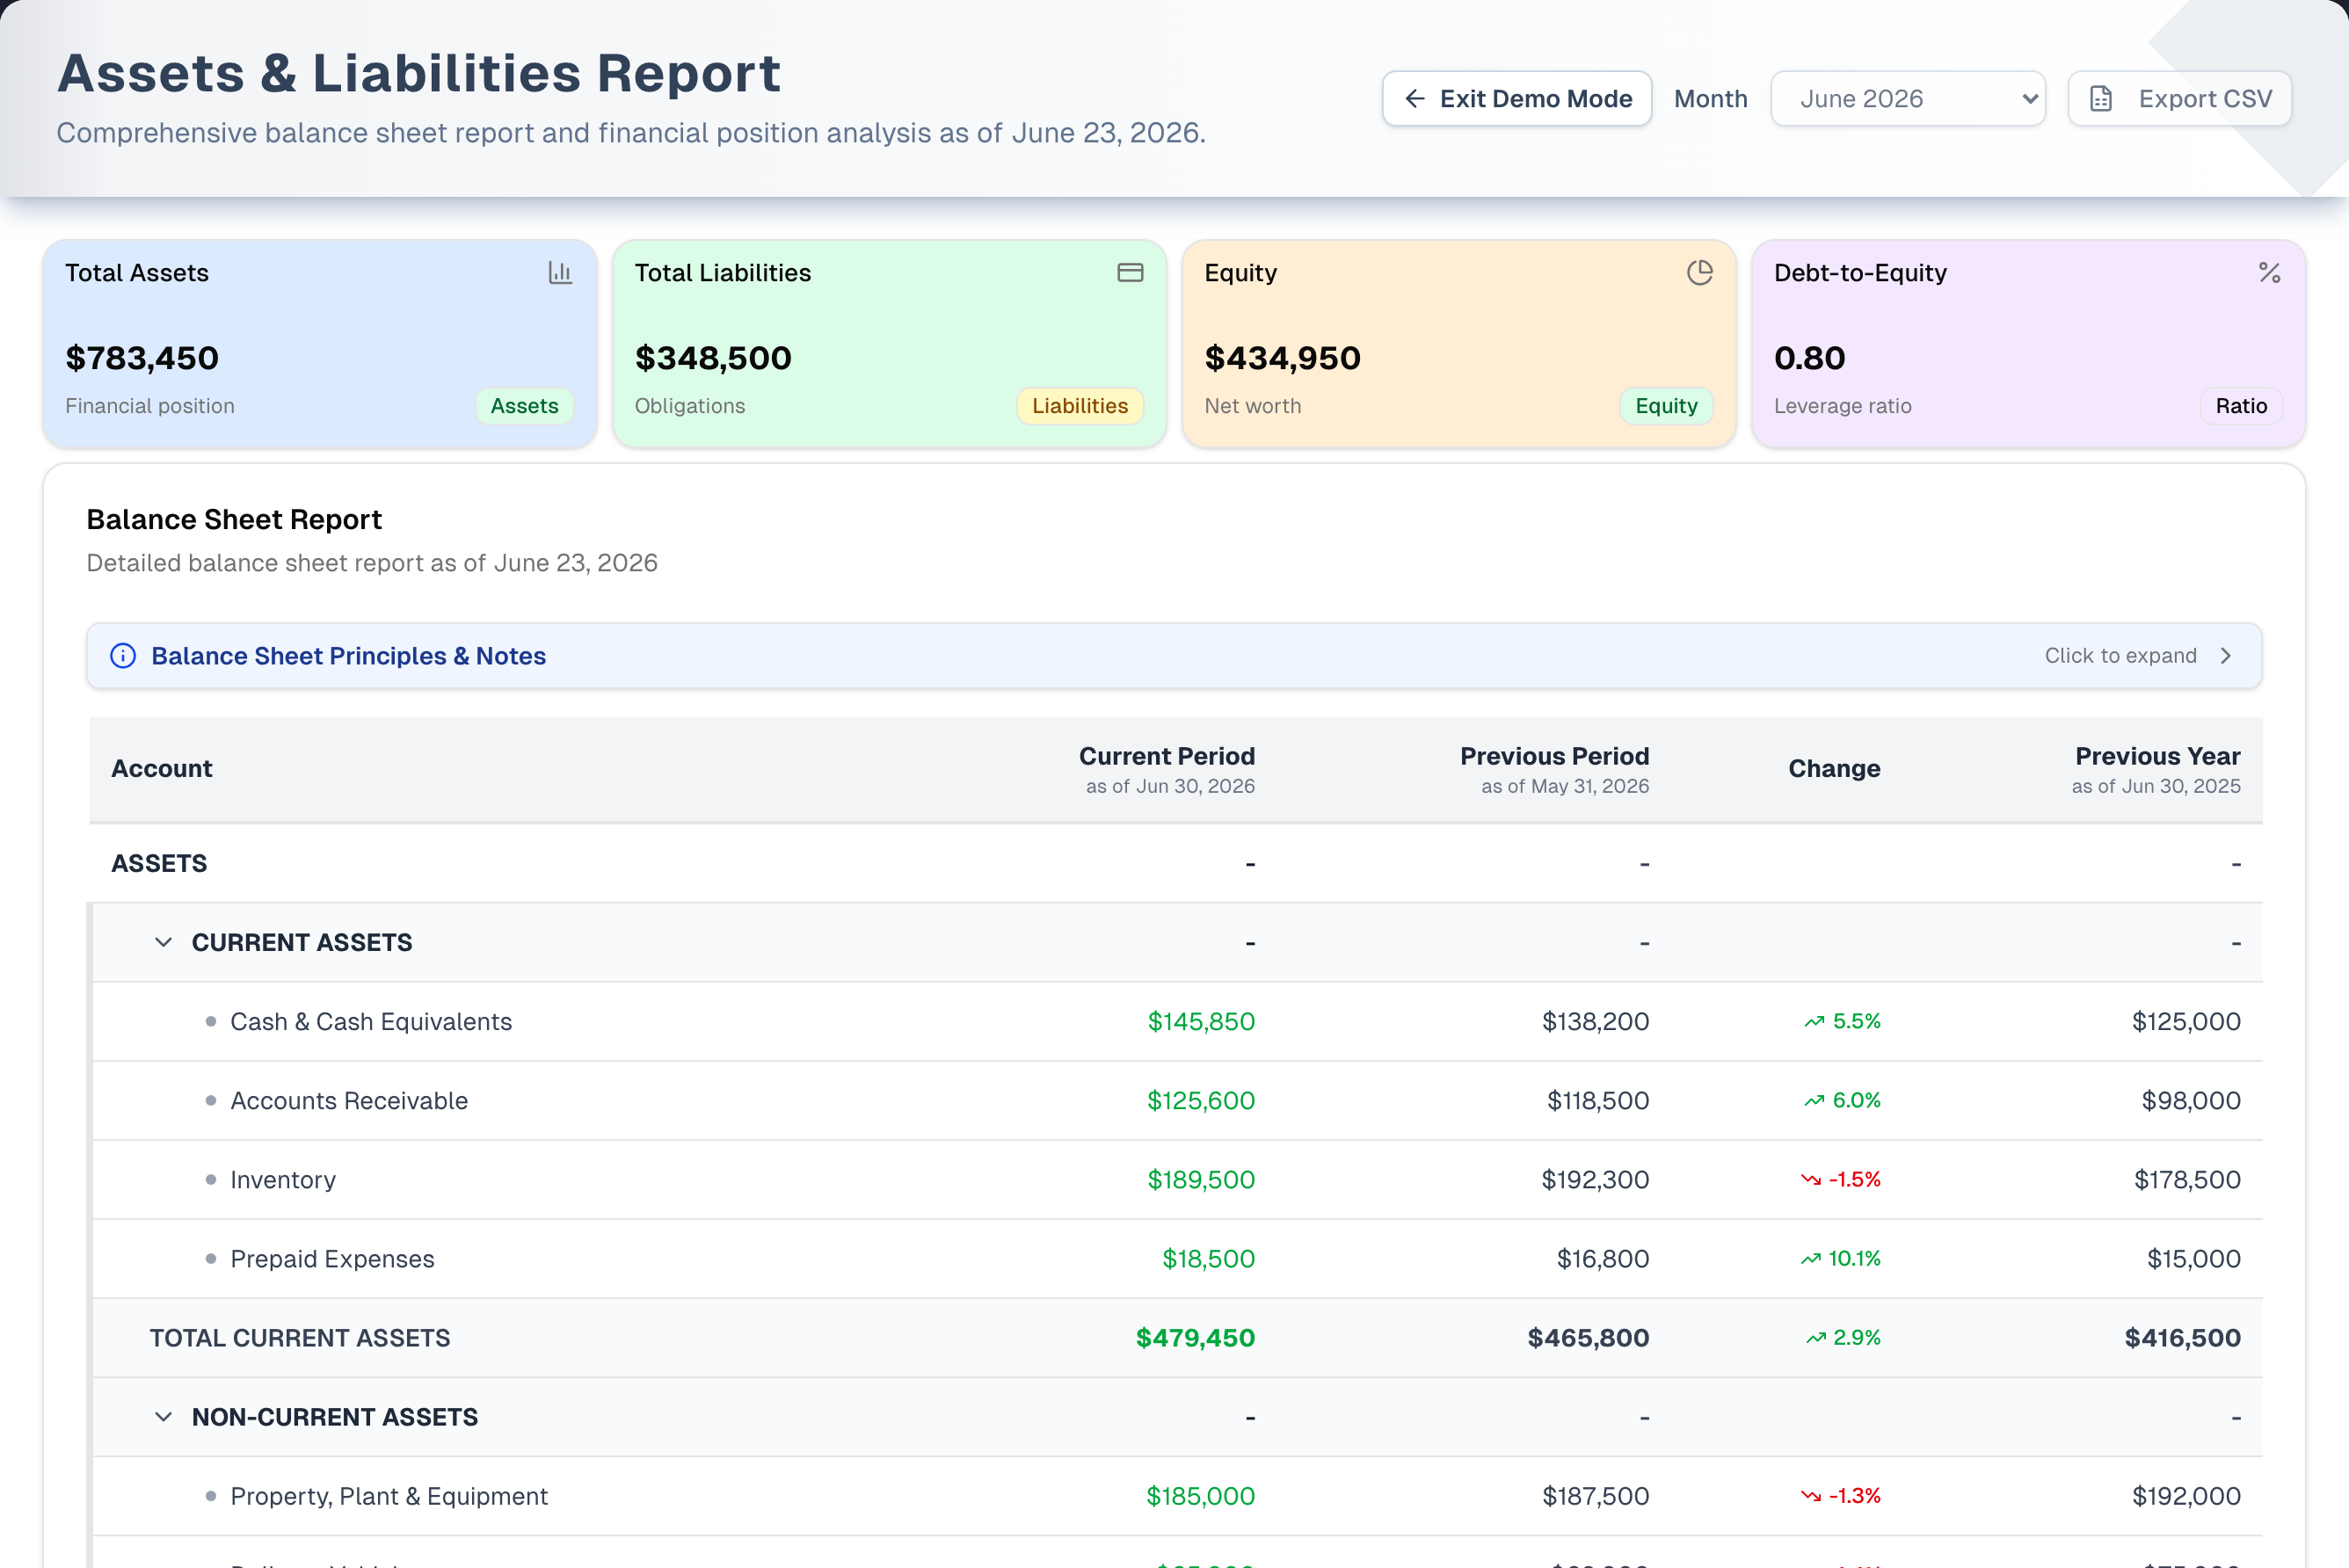
Overview
- Balance banner. A green Balanced. banner or an amber Out of balance by … banner at the top tells you whether Assets = Liabilities + Equity. A Balance check line under the statement shows the same gap.
- Four KPI cards: Total Assets, Total Liabilities, Shareholders Equity and Debt-to-Equity (liabilities ÷ equity, or N/A when equity is zero or negative).
- The statement runs ASSETS (Current, Non-Current) → TOTAL ASSETS → LIABILITIES & EQUITY (Current, Long-term) → TOTAL LIABILITIES → EQUITY → TOTAL EQUITY → TOTAL LIABILITIES & EQUITY.
- Lines are groups, not individual accounts. Each account is added into a named line such as Cash and Cash Equivalents, Accounts Receivable, Inventory, Sales Tax Payable, Customer Deposits or Owner's Equity, based mostly on words in its name, plus its type and category. Account names and codes never appear on this report. To see them, use Finance → Assets & Liabilities.
- Retained Earnings. Equity includes a computed Retained Earnings line, which is cumulative net income from your revenue and expense accounts. That's what ties the statement to your Profit & Loss, exactly.
- Sales in the books. Revenue is the money received on sales, so a sale your store books now never passes through Accounts Receivable or Customer Deposits, and Sales Tax Payable follows the money:
- Accounts Receivable holds only what customers still owe on sales booked before your store switched to counting revenue as the money received. What customers owe on newer sales isn't in the books until they pay it: read it from the orders list, in the Balance column and under the Unpaid and Partly paid payment filters.
- Customer Deposits holds money taken on orders that aren't sales, such as purchase orders. A deposit on a sale is revenue on the day it comes in.
- Sales Tax Payable is the tax inside the money received on sales (plus the tax booked at the sale on sales booked before the switch), not the tax owed on the sales you made. For that, read Sales tax on sales made in the range on the Sales Report.
- Hidden when empty. Non-Current Assets and Long-term Liabilities appear only when they have a balance, and equity lines only when they aren't zero. Current Assets, Current Liabilities and every TOTAL row always show.
- Retired accounts still count. An account switched off in Finance → Assets & Liabilities keeps whatever balance it holds, and this statement counts it: the money is real and has to be somewhere. The line it falls under is tagged incl. retired so the two pages agree about it.
- Depreciation and loans. Equipment and loans show their journal balance. An account shows an estimated depreciated value or remaining loan balance instead only when Auto-calc from depreciation or Auto-calc from amortization is ticked on it and its purchase or loan details are filled in. The line it falls under is tagged est., the estimate isn't posted to your books, and the out-of-balance banner says how much of the gap those estimates account for.
Plans and access
| Plan | What you get |
|---|---|
| Basic (no active trial) | The page is greyed behind an Unlock Pro & Premium Features card. The numbers behind it are sample data (Total Assets $835,000), not your books. On the page itself only the Demo button works. The sidebar item shows a small Pro tag. The page waits until your plan has been checked before it reads anything, so a Basic store never sees its own position here, even for a moment; if the check cannot be completed the page carries on after a few seconds rather than leaving you on the spinner |
| Pro | The full live report. Export CSV and Download PDF open Unlock Premium Features instead of exporting |
| Premium, or an active free trial | Everything, including CSV and PDF export |
Owners, managers and staff see the same numbers. The owner can hide the menu item for a team member in Settings → Team.
Step by step: review your position
- Open Reports → Assets & Liabilities. The report opens on the current month.
- Check the banner at the top. Balanced. means the sheet ties out. Out of balance by … gives you the gap to track down.
- Pick a month in Month (the current month or any of the 23 before it). All three columns reload.
- Read the KPI cards, then the statement. Change shows the % move from the previous month end.
- Click a section heading (Current Assets, Non-Current Assets, Current Liabilities or Long-term Liabilities) to fold its lines away. Its Total row stays.
- On Premium, click Export CSV or Download PDF. Both hold the complete balance sheet, whatever is folded on screen.
Key features
| Feature | What it does |
|---|---|
| Balance banner and Balance check | Green Balanced. when the gap is under $1. Amber Out of balance by … otherwise, with the gap = Total Assets − (Total Liabilities + Total Equity). The gap is never plugged into a total |
| KPI cards | Total Assets, Total Liabilities, Shareholders Equity, Debt-to-Equity |
| Grouped statement | Current and Non-Current assets, Current and Long-term liabilities and equity, each with subtotals. Lines are groups of accounts, chosen from the Type and Category you picked on the account, with the account name as a fallback |
| Three columns and Change | Current Period (end of the chosen month), Previous Period (end of the month before) and Previous Year (end of the same month last year). Change is the % move from Previous Period to Current Period, and is blank when either is zero |
| Auto-calc estimates | Only for accounts with Auto-calc from depreciation or Auto-calc from amortization ticked. Depreciation uses Straight Line, Declining Balance (double-declining, switching to straight line, no salvage value) or Sum of Years Digits. Loans amortize Weekly, Bi-weekly, Monthly, Quarterly or Annually. Set these on the account in Finance → Assets & Liabilities |
| Principles note | Balance Sheet Principles & Notes expands four short notes on the accounting equation, how balances are calculated, and how assets and liabilities are classified |
| Export CSV | Premium. Downloads balance-sheet-YYYY-MM.csv with raw numbers for every row, including folded ones |
| Download PDF | Premium. Opens a print-ready balance sheet on your store's letterhead in a pop-up, then your browser's Print dialog, where you choose Save as PDF. It prints every line of the statement, folded sections included, and has no Change column |
Tabs, views & filters
| Control | Options |
|---|---|
| Month | The current month and the 23 before it, newest first. Each column uses a month-end date. It opens on the current month every visit and has no custom date |
| Section headings | Click Current Assets, Non-Current Assets, Current Liabilities or Long-term Liabilities to fold or unfold its lines. All start open |
The report has no tabs, search, sorting, location filter or drill-down into accounts.
Tips & best practices
- Track Total Assets vs. Total Liabilities month over month to see net-worth movement.
- A debt-to-equity ratio above ~2.0 may signal high leverage.
- Compare the same month across years to surface seasonal patterns.
- Green and red arrows in Change show direction only. A liability going up is green too.
- For a sheet that ties out, give every asset and liability an opening balance, and enter real balances rather than relying on Auto-calc estimates.
- The PDF and the CSV both hold every row, whatever you have folded on screen.
- Prefer to explore first? Click the amber Demo button in the page header for a guided tour with sample data. See Demo mode.
Troubleshooting
| Issue | Fix |
|---|---|
| Banner says Out of balance by … | The gap is Total Assets − (Total Liabilities + Total Equity). Common causes: an asset or liability without an opening balance, activity that has no journal entry, or an account with Auto-calc ticked, because its estimate isn't in your books. When estimates are part of it the banner adds "The rows marked est. move this check by $…" — those lines carry an est. tag, and the amount can pull the gap either way, so it is not always a slice of it. Untick Auto-calc and enter the real balance in Finance → Assets & Liabilities |
| The numbers aren't mine (Total Assets $835,000) | Your store is on Basic, so the report is locked and shows sample data. Upgrade to Pro or higher on Plan & Billing |
| Export CSV or Download PDF opens Unlock Premium Features | Exports need Premium or an active free trial |
| Depreciation looks wrong | Estimates are used only when Auto-calc from depreciation is ticked and Purchase Price, Purchase Date and Useful Life are filled in. Check the method on the asset |
| Loan balance is off | Estimates are used only when Auto-calc from amortization is ticked and Original Amount, Start Date and Maturity Date are filled in. Also check the interest rate and payment frequency |
| An account is on the wrong line | Asset Type or Liability Type decides current or long-term, and together with Category it also picks the line inside that section. Open the account in Finance → Assets & Liabilities and set the Type and Category that fit — there is no need to rename it. See How lines are built under Detailed reference |
| Doesn't tie to the P&L | Equity includes a Retained Earnings line worked out from your journal entries, so it should tie out. Both statements count every expense account you have — an account the Profit & Loss has no named line for lands in its Other Operating Expenses, rather than being left out of it. If it's still off, look for a sale or expense that's missing its journal entry |
| PDF is missing a line you can see on screen | It shouldn't be: the PDF holds the whole statement. Check you are looking at the right month, then try Export CSV and compare |
| The browser says to allow pop-ups | The window is opened by your click, so this happens only when pop-ups are blocked outright for the site. Allow them, then click Download PDF again |
| Everything shows "-" | There are no accounts or journal entries yet. Set them up in Finance → Assets & Liabilities. A read that fails shows This balance sheet could not be loaded instead, so an empty sheet means there is nothing to show |
| This balance sheet could not be loaded | Your accounts or journal entries couldn't be read, and the sheet was cleared rather than left showing another month. The reason is on the card. Click Try Again |
| An entry dated the last day of the month shows up in the next month | Month end is 11:59:59 pm on the last day in your store's time zone, so a late sale still counts in its own month. If your store has no time zone set yet, your computer's time zone is used instead — set one in Settings → Organization |
What's next
- Maintain the accounts: Finance → Assets & Liabilities
- Review profitability: Reports → Profit & Loss
- Track spending: Reports → Expenses Report
Detailed reference
Every button, icon, field and message on this page, for when you need the exact detail. Each panel starts closed — open the one you need.
Page header and toolbar
| Control | Where | What it does | Notes |
|---|---|---|---|
| Assets & Liabilities (calculator icon) | Sidebar, Reports group | Opens this report | A small Pro tag shows beside it on Basic stores without a trial. Finance → Assets & Liabilities is a different page, where you edit the accounts |
| Page title Assets & Liabilities Report | Header, left | Heading only | The sidebar item is shorter: "Assets & Liabilities" |
| Subtitle "Comprehensive balance sheet report and financial position analysis as of …." | Under the title | Shows the last day of the month being read | Moves to the new month as soon as you pick one, so it always names the month the figures below belong to. After a failed load it still names the month you asked for, and the figures are gone |
| Demo (Play icon, amber) | Header, right, first control | Opens the demo with sample data in the same tab | Always shown. Still clickable when the page is locked for Basic. See the Demo mode panel below |
| Month dropdown | Header, right of Demo | Picks the "as of" month and reloads all three columns: Current Period = last day of the chosen month, Previous Period = last day of the month before, Previous Year = last day of the same month a year earlier | Options are the current month and the 23 before it, newest first, labelled like "September 2026". "Current" means the month it is now in your store's time zone. Opens on the current month every visit and isn't remembered. No calendar, custom date or future months. The current month includes entries dated later this month. Picking another month clears the sheet and shows "Loading the balance sheet…" until the new figures land, so one month's figures never sit under another month's dates. Can't be clicked while the page is locked |
| Export CSV (spreadsheet icon) | Header, right of Month | Premium or active trial: downloads balance-sheet-YYYY-MM.csv straight away, for the selected month. Pro: opens Unlock Premium Features and downloads nothing | File contents are in the table below. If the download fails, no message appears. Greyed out while the sheet is loading and after a failed load, so you can't download an empty balance sheet. Can't be clicked while the page is locked |
| Download PDF (document icon) | Header, far right | Premium or active trial: opens a pop-up window with a print-ready balance sheet, then your browser's Print dialog. Pro: opens Unlock Premium Features | Pop-ups must be allowed. Prints every line of the statement, folded sections included. Greyed out while the sheet is loading and after a failed load. See the PDF print window panel. Can't be clicked while the page is locked |
| Not on this page | — | No tabs, search, sorting, pagination, location filter, custom date range or drill-down | The report covers the whole store |
Export CSV file contents
| Part | What's in it |
|---|---|
| File name | balance-sheet-YYYY-MM.csv, where YYYY-MM is the selected month |
| Columns | Account, Current Period, Previous Period, Previous Year, Estimated, Retired accounts |
| Rows | Every statement row in on-screen order, including rows inside folded sections. Labels are indented two spaces per level: section headings, their Total rows and equity lines by two, the lines under a section heading by four. ASSETS, EQUITY and the TOTAL rows aren't indented |
| Numbers | Raw: no $ sign, no thousands separators and no rounding. Negatives carry a minus sign. Heading rows and zero balances show 0 |
| Estimated column | est on a line whose figure includes an auto-calculated depreciation or loan estimate for the selected month, empty on every other line — the same lines tagged est. on screen |
| Retired accounts column | incl. retired on a line that includes a switched-off account still holding a balance, empty on every other line — the same lines tagged incl. retired on screen |
| Not included | The Change column, the "as of" dates, the balance banner and the Balance check |
| Labels with a comma | Wrapped in quotes, for example "Property, Plant & Equipment" |
Section: Balance banner and KPI cards
| Control | Where | What it does | Notes |
|---|---|---|---|
| Green banner "Balanced. As of …, Assets = Liabilities + Equity. Equity includes Retained Earnings (cumulative net income from the ledger), so it ties to your Profit & Loss." | Top of the page, above the cards | Confirms TOTAL ASSETS equals TOTAL LIABILITIES + TOTAL EQUITY in the Current Period column | Shown when the gap is under $1 either way. Hidden while a month is loading, after a failed load, and while the page is locked for Basic. Not clickable |
| Amber banner "Out of balance by …. Balances are cumulative as of …. Equity includes Retained Earnings (cumulative net income from the ledger), but Assets still differ from Liabilities + Equity by this residual — usually unposted opening balances or operational activity not yet recorded as journal entries." | Same place | Warns that the sheet doesn't tie out and gives the gap | Shown when the gap is $1 or more, and hidden while a month is loading or after a failed load. Gap = Total Assets − (Total Liabilities + Total Equity). A positive gap means assets are higher. A gap in parentheses, for example "($250)", means liabilities plus equity are higher. The gap is never added into a total. It checks the Current Period only |
| Total Assets card (bar-chart icon), caption "Financial position", badge Assets | KPI row, 1st (blue) | Current Period TOTAL ASSETS | Not clickable. Negatives in parentheses |
| Total Liabilities card (credit-card icon), caption "Obligations", badge Liabilities | KPI row, 2nd (green) | Current Period TOTAL LIABILITIES | Not clickable |
| Shareholders Equity card (pie-chart icon), caption "Net worth", badge Equity | KPI row, 3rd (orange) | Current Period TOTAL EQUITY: your equity lines plus Retained Earnings | Not clickable. The demo calls this card "Equity" |
| Debt-to-Equity card (percent icon), caption "Leverage ratio", badge Ratio | KPI row, 4th (purple) | Total Liabilities ÷ Total Equity, to 2 decimals, for example "0.90" | "0.00" when there are no liabilities. N/A when equity is zero or negative |
| "-" in a card | Any card | The month loaded and that total is nothing | The cards, the banner and the table are shown together or not at all: while a month loads you see "Loading the balance sheet…" in their place, and if it fails you see This balance sheet could not be loaded instead |
Section: Balance Sheet Report (statement)
| Control | Where | What it does | Notes |
|---|---|---|---|
| Card title Balance Sheet Report, subtitle "Detailed balance sheet report as of …" | Top of the statement card | Heading only | Same date as the page subtitle |
| Balance Sheet Principles & Notes (info icon), "Click to expand" or "Click to collapse" and an arrow | Top of the card, blue panel | Click anywhere on the panel to show or hide the four notes below | Starts closed every visit. Clicking inside the open notes also closes it |
| Note Accounting Equation | Inside the open panel | "The balance sheet follows the fundamental accounting equation: Assets = Liabilities + Equity. This report shows your organization's financial position at a specific point in time, with all assets balanced against the claims on those assets (liabilities and equity)." | Fixed text |
| Note Balance Calculation | Inside the open panel | "Account balances are calculated from journal entries. For asset accounts, balance = debits - credits. For liability and equity accounts, balance = credits - debits. This follows standard double-entry bookkeeping principles." | Fixed text |
| Note Asset Classification | Inside the open panel | "Current Assets: Cash, accounts receivable, inventory, and other assets expected to be converted to cash or consumed within one year." and "Non-Current Assets: Property, equipment, vehicles, and other long-term assets. Fixed assets may be automatically depreciated based on their useful life and depreciation method." | Fixed text. Depreciation applies only with Auto-calc ticked |
| Note Liability Classification | Inside the open panel | "Current Liabilities: Accounts payable, short-term loans, and other obligations due within one year." and "Long-term Liabilities: Long-term loans, mortgages, and other obligations due beyond one year. Loan balances may be automatically calculated based on amortization schedules." | Fixed text. No note covers equity or Retained Earnings |
| Note Sales in the books | Inside the open panel | Three lines: "Accounts Receivable holds what customers still owe on sales booked before your store switched to revenue when paid. A newer sale is not in the books until it is paid: what customers owe on it is on the orders list, in the Balance column and under the Unpaid filter." / "Customer Deposits holds money taken on orders that are not sales, such as purchase orders. A deposit on a sale is revenue on the day it comes in." / "Sales Tax Payable is the tax inside the money received on sales (and the tax booked at the sale on sales booked before the switch), not the tax owed on the sales made. For that, read the Sales Report's 'Sales tax on sales made in the range'." | Fixed text. The PDF's notes carry the same three lines |
| "Updating…" with a small spinner | Above the table | The month on screen is being read again, after a change of store time zone. The figures stay readable until the new ones land | Picking a different month clears the sheet instead and shows "Loading the balance sheet…", and so does Try Again — there are no figures left to keep by then. Not shown while the page is locked |
| Column Account | Table header | The line's name | — |
| Column Current Period, "as of …" | Table header | Cumulative balance from your first entry to the end of the chosen month | The "as of" dates change as soon as you pick a month |
| Column Previous Period, "as of …" | Table header | Cumulative balance at the end of the month before | — |
| Column Change | Table header | % change from Previous Period to Current Period, to 1 decimal: (Current − Previous) ÷ the size of Previous × 100. Green up arrow = went up, red down arrow = went down, grey "0.0%" = no change | Blank when either value is zero. Direction only, so a liability going up is green too, and a less negative number counts as up. Previous Year is never compared |
| Column Previous Year, "as of …" | Table header | Cumulative balance at the end of the same month last year | — |
| Section headings Current Assets, Non-Current Assets, Current Liabilities, Long-term Liabilities (down arrow when open, right arrow when folded) | Table rows | Click to hide or show the lines under it. The section's Total row stays visible | All open by default. Folding stays when you switch months and resets when the page reloads. It changes the page only: folded lines are still in Download PDF and in the CSV. ASSETS, LIABILITIES & EQUITY, EQUITY and the TOTAL rows don't fold |
| Other rows (lines, subtotals, totals) | Table rows | Not clickable. Hover highlight only | No drill-down to accounts or journal entries. Use Finance → Assets & Liabilities for account detail |
| Left border colour | Each row | Green = asset rows, red = liability rows (TOTAL LIABILITIES & EQUITY is red too), blue = equity rows | — |
| Current Period amount colour | Each row | Green for positive asset and equity amounts. Red for positive TOTAL LIABILITIES and TOTAL LIABILITIES & EQUITY | Other columns are always grey |
| Grey dot | Before a line | Marks a detail line | Headings and totals show in capitals |
| Amber est. tag | After a line's name | At least one account on that line shows an auto-calculated depreciation or loan estimate for the chosen month instead of its journal balance | Hover it for "Auto-calculated estimate — not backed by journal entries". Only the chosen month decides the tag; the comparison columns don't. Equity lines are never tagged. The CSV's Estimated column marks the same lines |
| Grey incl. retired tag | After a line's name, after est. if both apply | At least one account on that line is switched off and still holds a balance for the chosen month | Hover it for "Includes a switched-off account that still holds a balance. It counts in the totals; open Finance → Assets & Liabilities to see which." The balance stays in every total — the money is real. Assets, liabilities and equity lines can all carry it. Only the chosen month decides the tag. The CSV and the PDF mark the same lines |
| Amount format | Every amount cell | "-" for zero. Negatives in parentheses, for example "($1,200)". No fixed cents on screen, for example "$1,234.5" | The PDF always shows 2 decimals |
| Balance check (Assets − Liabilities − Equity) | Under the table | "$0" in green when the gap is under $1. Otherwise the gap in amber | Sits outside the table and feeds no total. Matches the top banner. Hidden while the page is locked, while a month is loading and after a failed load |
Section: How lines are built
Row order
| Row | Shown when |
|---|---|
| ASSETS | Always |
| Current Assets → its lines → Total Current Assets | Heading and total always. A line shows if at least one asset account lands in it, even at zero ("-") |
| Non-Current Assets → its lines → Total Non-Current Assets | Only when some non-current line has a balance in any of the three columns |
| TOTAL ASSETS | Always |
| LIABILITIES & EQUITY | Always |
| Current Liabilities → its lines → Total Current Liabilities | Heading and total always. A line shows if at least one liability account lands in it, even at zero ("-") |
| Long-term Liabilities → its lines → Total Long-term Liabilities | Only when some long-term line has a balance |
| TOTAL LIABILITIES | Always, before Equity |
| EQUITY → its lines → Retained Earnings | An equity line shows only when it isn't zero in some column. The computed Retained Earnings line shows only when it isn't zero |
| TOTAL EQUITY | Always |
| TOTAL LIABILITIES & EQUITY | Always |
Which line an account lands in. Each account is added into the first line that matches it. A line matches on the account's Type, its Category, or a keyword (in brackets below) in its name, ignoring capitals. The last line in each section catches everything else.
| Section | Lines, in the order they're tried | How an account gets there |
|---|---|---|
| Current Assets | Cash and Cash Equivalents (cash), Accounts Receivable (receivable), Inventory (inventory), Prepaid Expenses (prepaid), Other Current Assets | An asset is current when its Asset Type is Current Assets. With no type set, it's current when its name contains cash, receivable, inventory or prepaid. Every other asset is non-current. The Category Cash & Cash Equivalents, Accounts Receivable or Inventory also picks the matching line |
| Non-Current Assets | Less: Accumulated Depreciation (accumulated depreciation), Intangible Assets (intangible, software, licence, license, patent, goodwill, trademark), Investments (investment), Property, Plant & Equipment (property, plant, equipment, ppe, building, vehicle, machinery), Other Non-Current Assets | The Asset Type picks the line: Fixed Assets → Property, Plant & Equipment; Intangible Assets → Intangible Assets; Investment Assets → Investments. The Categories Property & Buildings, Equipment & Machinery and Vehicles also pick Property, Plant & Equipment, and Software & Licenses picks Intangible Assets. Depreciation is tried first so an "Accumulated Depreciation — Equipment" account isn't counted as equipment |
| Current Liabilities | Sales Tax Payable (sales tax, tax payable), Customer Deposits (customer deposit, deposit, unearned, deferred revenue), Store Credit (store credit, or the code STORE_CREDIT: what customers can still spend as store credit), Credit Cards (credit card), Accounts Payable (accounts payable, payable), Accrued Liabilities (accrued), Short-term Debt (short-term debt, short term debt), Current Portion of Long-term Debt (current portion), Other Current Liabilities | A liability is current when its Liability Type is Current Liabilities. With no type set, it's current when its name contains payable, short, accrued, credit card, deposit, unearned, tax or store credit. Every other liability is long-term. The Category also picks the line: Accounts Payable → Accounts Payable, Credit Cards → Credit Cards, Accrued Expenses → Accrued Liabilities |
| Long-term Liabilities | Deferred Tax Liabilities (deferred tax), Deferred Revenue (deferred revenue, unearned), Long-term Debt (long-term debt, loan, debt, mortgage, bond), Other Long-term Liabilities | The Category picks the line: Long-term Loans, Mortgages and Bonds Payable → Long-term Debt; Deferred Revenue → Deferred Revenue |
| Equity | Common Stock (common stock), Additional Paid-in Capital (additional paid-in capital, apic), Retained Earnings (posted) (retained earnings), Treasury Stock (treasury stock), Owner's Equity (opening balance equity, owner's equity, owner equity, owner's capital, owner capital, contributed), Other Equity | Name only. The specific lines are tried before Owner's Equity, so "Additional Paid-in Capital" reaches its own line. Owner's Equity takes owner's capital, contributed capital and the opening balance |
| Equity (computed) | Retained Earnings | Not an account. It's cumulative net income up to each column's date: credits minus debits on all your revenue and expense accounts. An equity account of your own with that name is listed separately as Retained Earnings (posted) |
How the numbers are worked out
- Each column adds up every journal entry from your first one to that column's month end. It's a running total, not one month's activity.
- Asset balance = debits − credits. Liability and equity balance = credits − debits.
- Auto-calc from depreciation: when it's ticked on an asset that has a Purchase Price, Purchase Date and Useful Life, the line uses the depreciated value as of each column's date instead of the journal balance.
- Auto-calc from amortization: when it's ticked on a liability that has an Original Amount, Start Date and Maturity Date, the line uses the remaining loan balance, worked out from the interest rate and payment frequency.
- Without the tick, no depreciation or amortization is applied.
- Deactivated accounts still count.
- If you also have an equity account named "Retained Earnings" with a balance, it's listed as Retained Earnings (posted), above the computed Retained Earnings line. They are different money — one is what your books hold in that account, the other is profit worked out from the ledger — so both are shown and both count towards TOTAL EQUITY.
- Month end is 11:59:59 pm on the last day of the month in your store's time zone (Settings → Organization → Business Timezone), so an entry posted late in the evening still counts in that month, and the "as of" dates read as the last day of the month wherever you open the report from. Stores with no time zone set fall back to the time zone of the computer you're using.
Dialog: Unlock Premium Features
Opens when a store that isn't on Premium and has no active trial (a Pro store) clicks Export CSV or Download PDF. It's a small card in the middle of a dimmed page.
| Control | Where | What it does | Notes |
|---|---|---|---|
| Lock icon, Unlock Premium Features, "Advanced reporting & data export" | Purple header | Header text | — |
| Check Details (green) | Header, right | Closes the card and opens Plan & Billing | — |
| Premium chip and list: "Everything in Pro", "2,000 SMS/month", "Advanced reporting (grouped/pivot)", "CSV / PDF data export" | Body | Plan summary | Names both formats, whichever button opened it |
| X (header, right of Check Details), the Esc key, or the dimmed area outside the card | Header or around the card | Closes the card. Nothing is downloaded | Clicking the card itself doesn't close it |
Dialog: Unlock Pro & Premium Features (page lock)
Shown over the whole report for Basic stores with no active trial. The page behind it is greyed and can't be clicked, except the amber Demo button.
| Control | Where | What it does | Notes |
|---|---|---|---|
| Lock icon, Unlock Pro & Premium Features, "SMS, insights, finance tools & more" | Card header, centred on screen | Header text | Not shown while your plan is still loading, or if the app can't confirm your plan |
| Check Details | Card header | Opens Plan & Billing | The card header's only button |
| Pro column: "500 SMS/month + a dedicated phone #", "SMS campaigns & review invites", "Ads-vs-store insights", "Finance: expenses, assets, reports", "Customer Portal: tracking, payments, scheduling" | Card body, left | Plan summary | — |
| Premium column: "Everything in Pro", "2,000 SMS/month", "Advanced reporting (grouped/pivot)", "CSV / PDF data export", "Workforce: time clock, timesheets, pay runs" | Card body, right | Plan summary | — |
| Numbers behind the card | Greyed page | Sample data, not your books: Total Assets $835,000, Total Liabilities $395,000, Shareholders Equity $440,000, Debt-to-Equity 0.90 | No balance banner and no Balance check. Month, Export CSV and Download PDF can't be clicked |
Dialog: PDF print window
| Element | What it contains or does | Notes |
|---|---|---|
| Pop-up window, then the Print dialog | A new window opens the moment you click, showing "Preparing your report…" while your store details load. The print-ready report replaces it, then your browser's Print dialog opens within about a second. Choose Save as PDF or a printer there | Your browser picks the file name and folder. The window's title is "Balance Sheet (Assets & Liabilities) — " followed by your store name. Closing the window while it still reads "Preparing your report…" cancels the download and nothing else happens |
| Letterhead | Store name in capitals, then address, then phone • email, from your store profile and first location | "Your Business" if your store details can't be loaded |
| Title block | "Balance Sheet (Assets & Liabilities)", "As of …" and "Generated …" with the date and time | — |
| Table | Account, Current Period, Previous Period and Previous Year, each with its "as of" date. Amounts to 2 decimals, negatives in red parentheses, zeros as "-" | No Change column. Every line of the statement is printed, whatever is folded on screen. An auto-calculated line reads "… (est.)" after its name, matching the note under the table, and a line holding a switched-off account reads "… (incl. retired)" |
| Notes under the table | 1. "Balances are cumulative as of the date shown, derived from journal entries (assets = debits − credits; liabilities & equity = credits − debits)." 2. "Equity includes a "Retained Earnings" line = cumulative net income from the ledger income accounts, so it ties to the Profit & Loss." 3.–5. The three Sales in the books lines, as in the panel. 6. "Balance check (Assets − Liabilities − Equity): …." 7. "Rows marked "est." are auto-calculated estimates, not posted to your books. They move the balance check by …." | Note 6 shows $0 when the gap is under $1. It appears only once the month has loaded. Note 7 appears only when estimates move the check by $1 or more |
| Footer | "Balance Sheet (Assets & Liabilities)" on the left, "Generated by UpChannels" on the right | — |
| Browser alert "Please allow pop-ups for this site to download the PDF report." | Shown instead of the window when your browser blocks pop-ups for the site | Allow pop-ups for the app's site, then click Download PDF again |
Messages you may see
| Message | When it appears | What to do |
|---|---|---|
| "Loading the balance sheet…" with a spinner, in place of the banner, the cards and the table | While the selected month loads | Wait. The report reads your whole history up to the month you picked, in batches, and works the two comparison columns out of that same read, so a long history can take a moment |
| "Updating…" with a small spinner above the table | The month already on screen is being read again, after a change of store time zone | Wait. The figures stay readable until the new ones land |
| "Balanced. As of …, Assets = Liabilities + Equity. Equity includes Retained Earnings (cumulative net income from the ledger), so it ties to your Profit & Loss." | The gap is under $1 | Nothing to do |
| "Out of balance by …. Balances are cumulative as of …. Equity includes Retained Earnings (cumulative net income from the ledger), but Assets still differ from Liabilities + Equity by this residual — usually unposted opening balances or operational activity not yet recorded as journal entries." | The gap is $1 or more | Check that each asset and liability has an opening balance, and look for activity with no journal entry. Also check accounts with Auto-calc ticked, because their estimate isn't in your books |
| "The rows marked est. move this check by $… — they are auto-calculated estimates that are not posted to your books." | Added to the out-of-balance banner when auto-calculated estimates move the balance check by $1 or more | The amount is how far the estimates shift the check, not always a share of the gap: it can pull the other way, and then it shows in brackets. Untick Auto-calc on those accounts and enter the real balance |
| "Balance check (Assets − Liabilities − Equity)" with "$0" (green) or an amount (amber) | Under the table, once the month loads | Same meaning as the banner |
| "No organization ID found for current user" on the This balance sheet could not be loaded card | Your session isn't linked to a store | Sign out and sign back in |
| This balance sheet could not be loaded, with the reason underneath and a Try Again button | Your accounts or your journal entries couldn't be read | Click Try Again. If it keeps happening, contact support. "Nothing is shown below rather than figures from another month" — the banner, the cards and the table are cleared, so a month that did load can never be mistaken for this one |
| No message, every value "-" or $0 | A new store with no accounts or journal entries yet. A read that fails shows the This balance sheet could not be loaded card instead, so an empty sheet really is an empty sheet | Set up accounts and opening balances in Finance → Assets & Liabilities |
| N/A in Debt-to-Equity | Total Equity is zero or negative | Expected. The ratio means nothing when equity is zero or below |
| Blank Change cell | Current Period or Previous Period is zero | Expected |
| Unlock Premium Features, "Advanced reporting & data export" | A Pro store clicked Export CSV or Download PDF | Exports need Premium or an active free trial. Check Details opens Plan & Billing |
| Unlock Pro & Premium Features, "SMS, insights, finance tools & more" | A Basic store with no trial opened the report | Upgrade to Pro or higher. The numbers behind the card are sample data |
| Browser alert "Please allow pop-ups for this site to download the PDF report." | Download PDF with pop-ups blocked for the site | Allow pop-ups for the site and try again |
| "403 - Forbidden", "You do not have permission to view this page. Contact your organization owner." | The owner has hidden this report from you | Ask the owner to switch it back on in Settings → Team |
| Demo banner "Demo mode — balance sheet is populated with sample data. All actions are disabled." | On the demo page | Click Exit Demo Mode to return to the live report |
Who can use what
| Who | What they get |
|---|---|
| Basic plan, no active trial | The report is locked behind Unlock Pro & Premium Features with sample data. On the page itself only Demo works; the card's own buttons open Plan & Billing. The sidebar item shows a Pro tag |
| Pro plan | The full live report: Month, section folding and the notes panel. Export CSV and Download PDF open Unlock Premium Features |
| Premium plan, or an active free trial | Everything, including CSV and PDF export. If you already picked a plan during your trial, that plan's rules apply straight away |
| Plan can't be confirmed | The report stays open with everything available |
| Owners, managers and staff | The same report and numbers. There are no role-based differences on this page, and each store only ever sees its own books |
| Team members with the item hidden | In stores with more than one active person, the owner can hide Assets & Liabilities in the Reports section for a person in Settings → Team. That person gets "403 - Forbidden" if they open the page (it can take up to a minute to apply). The demo page stays open to them. Items can't be hidden for someone whose Owner switch is on, and nothing is blocked while the store has only one active person — people switched off or removed in Team don't count |
| Everyone, including Basic | The demo page has no plan lock |
Demo mode (/finance/report-assets-liabilities/demo)
- Open it: click Demo (Play icon, amber) in the page header. It works even when the page is locked for Basic.
- Header: "Assets & Liabilities Report — Demo", with the subtitle "Comprehensive balance sheet report and financial position analysis as of …." showing today's date, not the month end.
- Banner: "Demo mode — balance sheet is populated with sample data. All actions are disabled." (eye icon), with Take a Tour (question-mark icon) at its right end.
- Disabled: Month is faded and fixed to the current month. Export CSV and Download PDF are faded and do nothing.
- Still works: Balance Sheet Principles & Notes, folding sections, Take a Tour and Exit Demo Mode.
- Tour: starts automatically the first time the demo opens; once you have closed it your browser remembers, so it doesn't open by itself the next time and Take a Tour restarts it from step 1. It shows progress dots, an "N of 5" counter, Back (from step 2 on), Skip (closes), Next, and Got it! on the last step (closes). Keyboard: Esc closes, Right arrow or Enter goes to the next step (closes on the last), Left arrow goes back. Enter is left to whatever you have focused — a field, or a button such as Next — so it doesn't also move the tour; the arrows keep working after you click Next with the mouse. Clicking the dark background closes the tour. While the tour is open you can't click the page.
- Leave: Exit Demo Mode (left-arrow icon, first control in the header) returns to the live report.
| # | Tab | Tour step | What it points at |
|---|---|---|---|
| 1 | — | Month Selector | The Month label and dropdown. "Select the reporting month to view the balance sheet for that period. The report compares current period, previous period, and previous year side-by-side." |
| 2 | — | Export CSV and Download PDF | The Export CSV and Download PDF buttons. "On your live report, download the whole balance sheet as a CSV for spreadsheets, or as a PDF on your store letterhead to print or send to your accountant. Both hold every row, folded sections included. Both need Premium, and both are off in this demo." |
| 3 | — | Financial Summary | The four KPI cards. "At-a-glance metrics showing Total Assets, Total Liabilities, Equity, and the Debt-to-Equity ratio — key indicators of your financial health." |
| 4 | — | Balance Sheet Principles | The Balance Sheet Principles & Notes panel. "Click to expand educational notes about the accounting equation, balance calculation methods, and asset/liability classification rules." |
| 5 | — | Balance Sheet Table | The statement table. "The full balance sheet report with collapsible sections. Click section headers (Current Assets, Non-Current Assets, etc.) to expand or collapse. Color-coded borders indicate asset (green), liability (red), and equity (blue) sections." |
Sample data matches your store's industry. Any other industry, including "Other", gets the Electronics Retail set. Every set balances exactly.
| Industry | Total Assets | Total Liabilities | Equity | Debt-to-Equity |
|---|---|---|---|---|
| Appliance Retail | $783,450 | $348,500 | $434,950 | 0.80 |
| Furniture Retail | $952,200 | $452,000 | $500,200 | 0.90 |
| Electronics Retail (also the default, and the sample behind the Basic lock) | $835,000 | $395,000 | $440,000 | 0.90 |
| Liquidation Retail | $1,113,000 | $475,000 | $638,000 | 0.74 |
| Apparel Retail | $501,000 | $238,000 | $263,000 | 0.90 |
| HVAC Services | $858,000 | $332,000 | $526,000 | 0.63 |
| Plumbing Services | $508,000 | $209,000 | $299,000 | 0.70 |
| Appliance Services | $657,000 | $268,000 | $389,000 | 0.69 |
Differences from the live page:
- No Balanced or Out of balance banner, and no Balance check line.
- The third KPI card is titled Equity. The live page says Shareholders Equity.
- Non-Current Assets and Long-term Liabilities always show, with account-style line names such as "Delivery Vehicles", "Commercial Mortgage" and "Cash & Cash Equivalents". The live page uses fixed group names such as "Cash and Cash Equivalents" and hides empty non-current and long-term sections.
- Row order: the demo shows EQUITY → TOTAL EQUITY → TOTAL LIABILITIES → TOTAL LIABILITIES & EQUITY. The live page puts TOTAL LIABILITIES before Equity.
- Retained Earnings is a fixed sample figure. On the live page it's worked out from your books.
- The page subtitle and the card subtitle show today's date. The column "as of" dates show month ends.
See Demo mode for how demos work across the app.
Common questions
Where did $835,000 in Total Assets come from? Those aren't my numbers. Your store is on Basic with no active trial, so the report is locked and shows sample data behind the Unlock Pro & Premium Features card. The demo page shows sample data too. Upgrade to Pro or higher to see your own books.
Why does the banner say Out of balance? Total Assets don't equal Total Liabilities + Total Equity by $1 or more. The usual causes are an asset or liability with no opening balance posted against equity, activity that was never recorded as a journal entry, or an account with Auto-calc from depreciation or Auto-calc from amortization ticked. Its estimate replaces the journal balance, and nothing posts a matching equity entry — the line carries an est. tag and the banner names the amount those estimates move the gap by, so you can tell that part from the rest. Untick Auto-calc and enter the real balance in Finance → Assets & Liabilities.
Why can't I see my individual accounts? The report adds accounts into named lines such as Cash and Cash Equivalents or Other Non-Current Assets, and never lists account names or codes. There's no drill-down. Use Finance → Assets & Liabilities to see each account.
Why is my vehicle or building under Other Non-Current Assets? It shouldn't be, as long as the account carries a Type and a Category. Asset Type Fixed Assets puts an account on Property, Plant & Equipment, Intangible Assets on Intangible Assets and Investment Assets on Investments, whatever the account is called — so a "Delivery Van" set to Fixed Assets and Vehicles lands on Property, Plant & Equipment. (One deliberate exception: an account with accumulated depreciation in its name goes to Less: Accumulated Depreciation first, so it isn't counted as equipment.) The Categories Property & Buildings, Equipment & Machinery and Vehicles do the same on their own, and Software & Licenses picks Intangible Assets. Other Non-Current Assets is left for accounts with no Type, no matching Category and no matching word in the name. Open the account in Finance → Assets & Liabilities and set its Type and Category rather than renaming it. An asset with no Asset Type and a name without cash, receivable, inventory or prepaid is still treated as non-current.
Why is the Change column blank, or green when a liability went up? Change is left blank when either the Current Period or the Previous Period is zero. The arrow shows direction only: up is green and down is red, whatever the row. So a liability that grew shows a green arrow.
Does folding a section change what I download? No. Folding only tidies the page: Download PDF and Export CSV both hold the complete statement. The PDF opens in a pop-up window. If your browser blocks pop-ups for the site, you'll see "Please allow pop-ups for this site to download the PDF report." Allow pop-ups and click again, then choose Save as PDF in the Print dialog.
I'm on Pro. Why does Export CSV open Unlock Premium Features? CSV and PDF export need Premium or an active free trial. Pro gets the full live report on screen.
Why is Accounts Receivable so small now, and where did Customer Deposits go? Revenue is the money received on sales, so a sale is booked when it is paid: Dr Cash, Cr Revenue and Sales Tax Payable, with nothing owed in between. Accounts Receivable holds what customers still owe on sales booked before your store switched, and it runs down as they pay. What customers owe on newer sales is on the orders list (Balance column, Unpaid and Partly paid payment filters). On the switch day, deposits your store was holding on sales became revenue, so Customer Deposits holds only money on orders that aren't sales, such as purchase orders.
Does Sales Tax Payable show the tax I owe? It shows the tax inside the money received on sales, which is what you owe if you file on money collected. If you file on sales made, use Sales tax on sales made in the range on the Sales Report for the same days.
Why do I see Retained Earnings and Retained Earnings (posted)? The report works out Retained Earnings itself from your revenue and expense accounts, and shows it whenever that figure isn't zero. If you have also posted an equity account of your own named "Retained Earnings", it is listed beside it as Retained Earnings (posted) so the two are told apart. Both count toward TOTAL EQUITY, which usually means the profit is in there twice — worth checking the posted account. Finance → Assets & Liabilities calls it Retained Earnings (posted) too, so both screens name it the same way.