Dashboard
The Business Dashboard is your daily command center, stacked into sections from quick actions to a live activity feed.
Overview
Most cards are clickable and drill into the matching page. Sections appear top to bottom.
Sections in detail
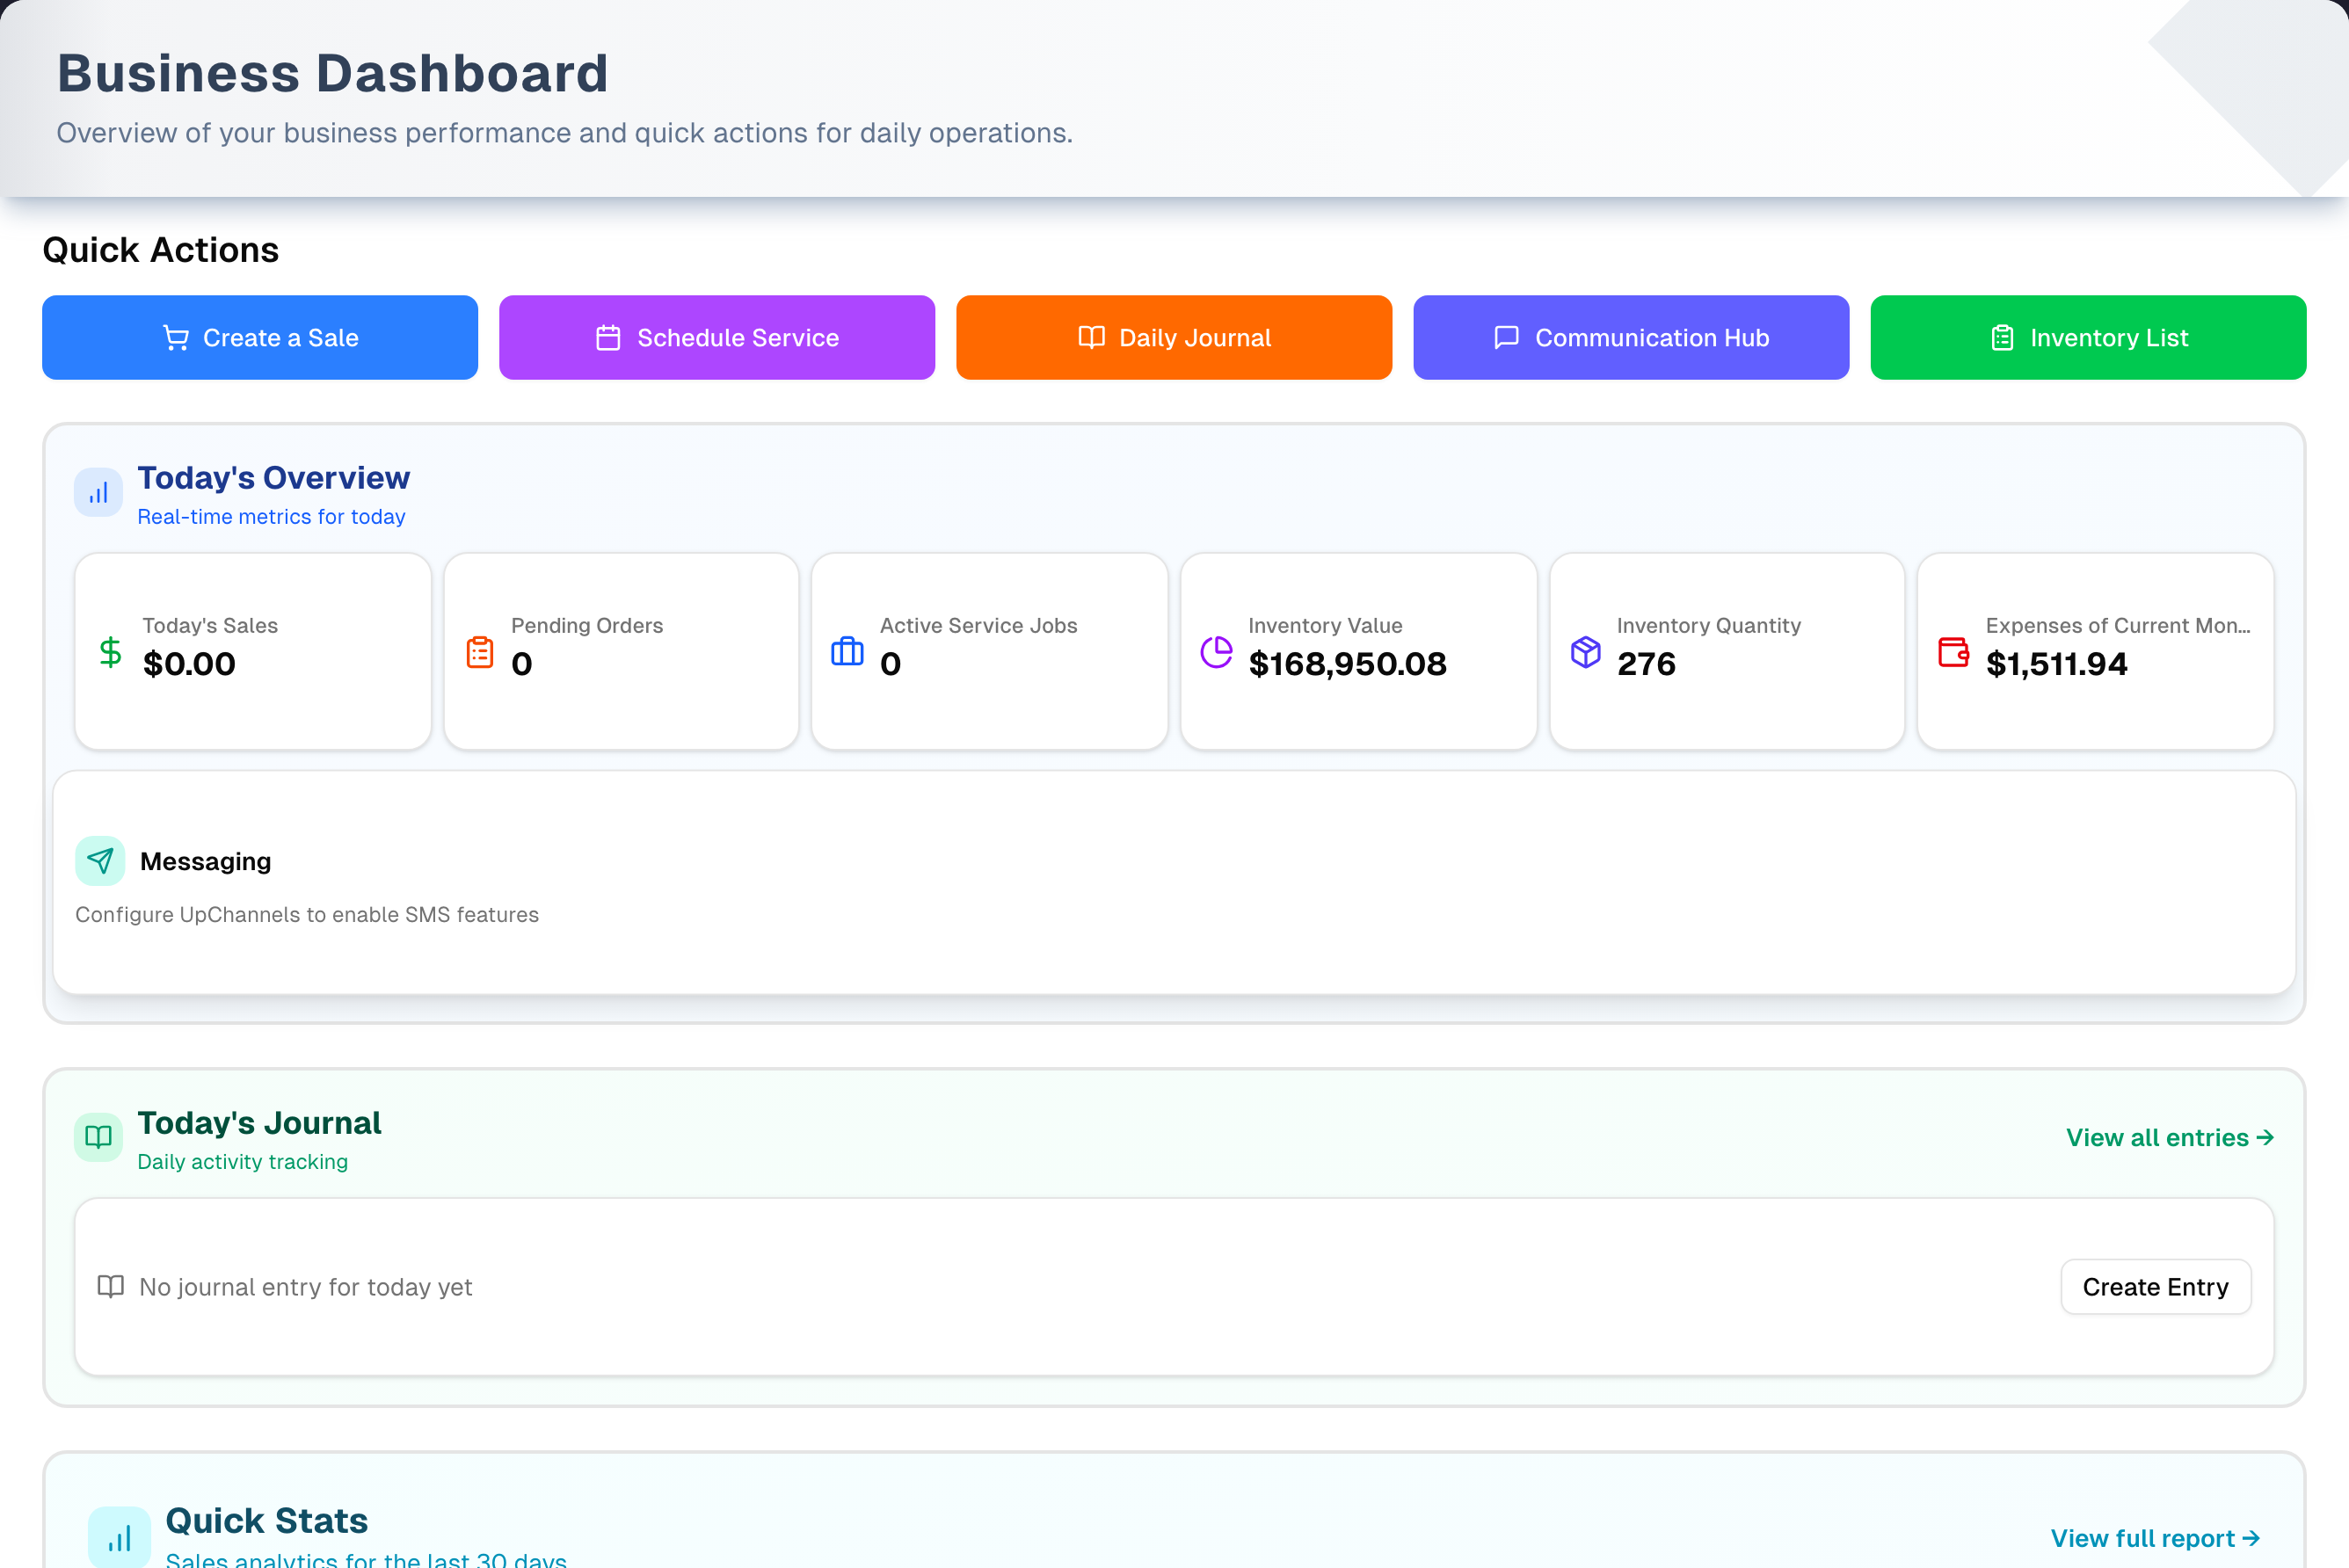
Quick Actions
One-click shortcuts: Create a Sale, Schedule Service, Daily Journal, Communication Hub, Inventory List.
Today's Overview
Six live metric cards: Today's Sales, Pending Orders, Active Service Jobs, Inventory Value, Inventory Quantity, Expenses of Current Month. A Messaging usage card (outbound/inbound/conversations + quota bar) appears when SMS is configured.
Today's Journal
Mini 7-day charts for Inbound Calls, Outbound Calls, and Door Traffic, plus work-log cards (Operations, Marketing, Sales, Service, Management) when today's entry exists.
Quick Stats (30 days)
A daily-sales bar chart with total revenue/orders, plus Top Products and Top Services (ranked top 5 by revenue and units).
Key Performance Indicators
Six KPIs vs. the prior 30 days: Sales Revenue, Avg Transaction Value, Orders with Service, New Customers, Customer Repeat Rate, Total Orders — each with a trend.
Recent Activity
A paginated feed of orders (sale/quote/return/procurement), inventory movements, and service jobs — color-coded, with relative timestamps. Toggle Last 24h / Last 7 days and items per page (10/20/50).
Step by step: read your dashboard
- Scan Today's Overview; click a card to drill in.
- Check Today's Journal; add an entry if empty.
- Read Quick Stats and KPIs for 30-day trends.
- Browse Recent Activity, adjusting the time window.
Tips & best practices
- Just created an order and still see $0? Data loads live; refresh after a moment.
- An amber Inventory Value warning means 500+ SKUs and a capped display — archive inactive SKUs.
- KPI trends show "—" when the prior 30-day period had no data to compare.
Troubleshooting
| Issue | Fix |
|---|---|
| Today's Sales shows $0 despite recent orders | Refresh; confirm the order isn't still a draft |
| Active Service Jobs shows 0 | Completed/cancelled/no-show jobs are excluded — check the Schedule |
| SMS/Messaging card missing | SMS isn't configured; enable it in Settings |
| Recent Activity empty | Nothing in the window — switch to Last 7 days |
What's next
- Ring up a sale: Sales → New
- Log your day: Reports → Daily Journal
- Dig into revenue: Reports → Sales Report