Lost Sales Report
Everything the walk-in log collected, read a month at a time. Every number here is an estimate from what your team logged — the report says so on every screen, because a log with thin coverage produces a conversion rate that looks like good news. The report only reads: the one action is Export CSV. It is on every plan.
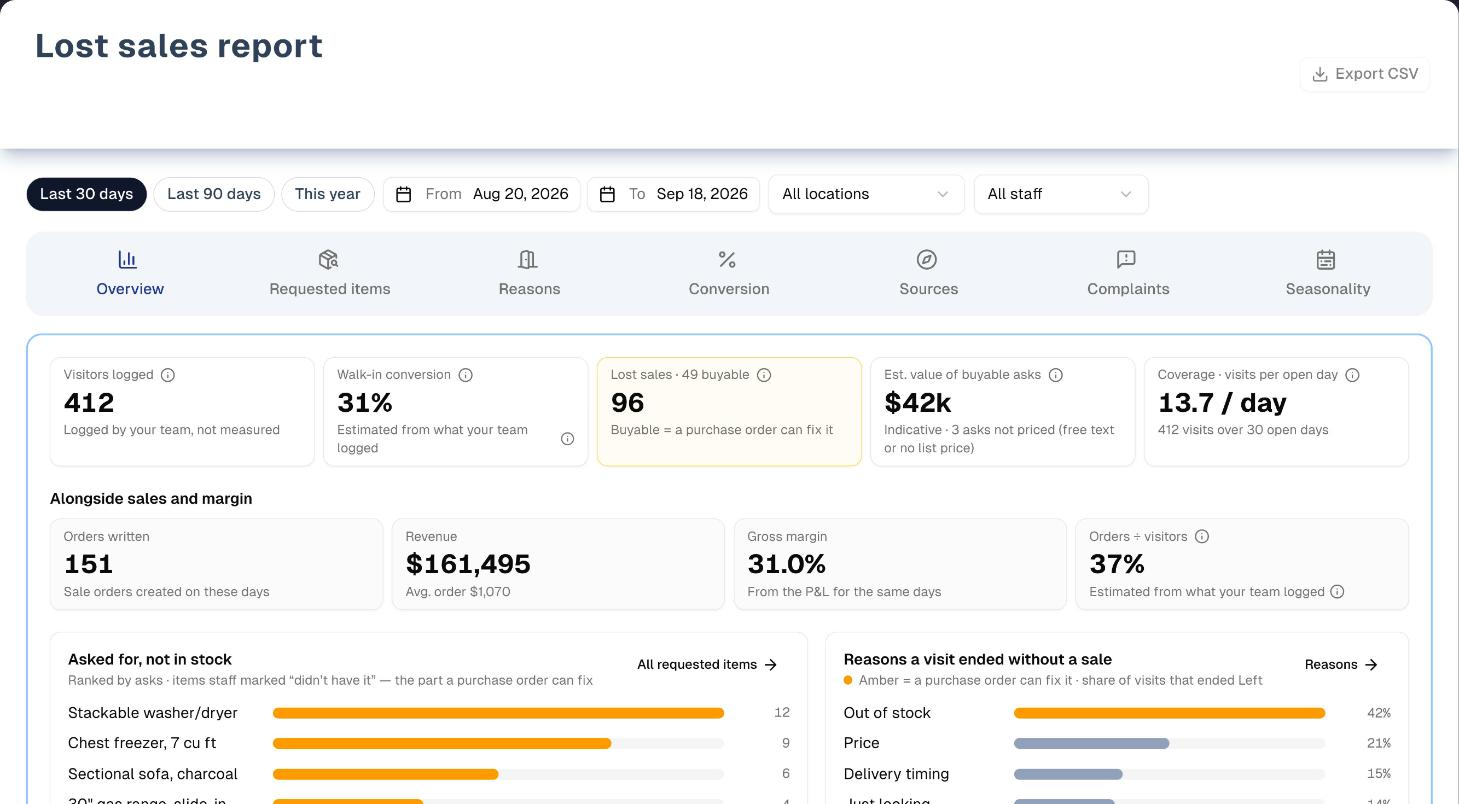
Overview
Open Reports → Lost sales. The page is headed Lost sales report. Three filters sit above the tabs, and days follow your store's own time zone:
- Range: Last 30 days (the default), Last 90 days, This year, or a custom range picked with the From and To calendars.
- Location: All locations or one location. It only appears when your store has more than one location.
- Staff: All staff or one person.
Not everything follows every filter. Requested items always covers the whole team, Gross margin is always store-wide, and Complaints ignore the staff filter.
| Tab | What it answers |
|---|---|
| Overview | Visitors, conversion, lost sales and coverage, next to the same period's orders, revenue and gross margin |
| Requested items | What people asked for and you did not have, ranked by asks, with how many are still waiting for a text and what is available now |
| Reasons | Why visits ended without a sale, split into the ones a purchase order can fix (buyable) and the ones it cannot — price, timing, financing, browsing, service |
| Conversion | Over time (by day, week or month), by weekday, by hour, by location and by staff member — each person next to how many visits they logged |
| Sources | Where visitors said they came from, and which sources bring buyers |
| Complaints | Complaints opened in the range: what is still open or overdue, the median time to settle, and the split by category, severity and owner |
| Seasonality | Asks per month for the top items, for the things that only sell in one season |
Visits that end Sold or Special order count as a sale — a special order is still something the customer bought. A visit that ends in a quote does not. Walk-in, phone and online visits all count as visitors. Lost-sale records made from a lost quote or from the order form count as lost sales but not as visitors.
Step by step: the monthly read
- Set the range to last month: pick the 1st in From and the last day in To. There is no "last month" button. Leave Location on All locations and Staff on All staff.
- Start with coverage. Check the Coverage · visits per open day card on Overview and the Logged column under Conversion → By staff. If coverage is thin, or one person's Logged is near zero, stop there. Conversion and the reason mix are not trustworthy yet, and this month's job is making the log habit stick.
- Requested items: take the top ten to your next purchase order. Open Replenish opens Procurement Orders (Inventory → Procurement) on its New Order tab. There, Add to PO in Requested, not stocked adds each item as a line on the order. Until your store has created its first purchase order, New Order is locked and you land on Import instead, with a notice saying so.
- Reasons: look at the buyable share. That is the part of the problem stock can fix; price and timing need a different answer.
- Conversion: find the weekday or hour that reads far below your own average, and ask what is different about it.
- Complaints: one root cause per repeating category beats ten heroic saves.
Key features
| Feature | What it does |
|---|---|
| Estimate caption | Every conversion number carries "Estimated from what your team logged" |
| Sales alongside | Sales made, revenue and gross margin for the same days. Revenue is the money received on sales, less refunds, as on the Dashboard. Orders and revenue follow the location and staff filters. Gross margin is always the whole store |
| CSV export | Requested items (always the whole team) or Visits (every visit in the range, up to the newest 20,000), for the range and filters shown |
| Staff view | Conversion per person next to how many visits they logged |
| Complaint tables | Category, severity and owner, with a median time to settle |
| Demo | The report on sample data, with a 12-step guided tour. See Demo mode |
Tabs, views & filters
| Control | Options |
|---|---|
| Range | Last 30 days (default), Last 90 days, This year, or a custom range from the From and To calendars |
| Location | All locations, or one location. Only shown when the store has more than one |
| Staff | All staff, or one person. Requested items, gross margin and complaints stay whole-team |
| Day / Week / Month | Grouping for Conversion over time. Only the choices that suit the range appear |
| Export CSV | Requested items, or Visits |
Tips & best practices
- Compare the store with itself. Published retail conversion ranges are directional at best; the number that matters is your own trend.
- Someone who logs every visitor shows a lower conversion rate than someone who logs only buyers. Read the Logged column before you read the rate.
- A long range is a better read than a short one for reasons and seasonality; a short one is better for coverage.
- Log visits live if you want the hour chart. Visits typed in at the end of the day have approximate times, so Conversion by hour leaves them out.
Troubleshooting
| Issue | Fix |
|---|---|
| Conversion is missing, or a tab says "No visits logged in this range." | No visits were logged in the range. Start in Sales → Walk-ins |
| Visitors don't match the Daily Journal's door traffic | They are different counts. Door traffic is confirmed or typed in at close of day in the Daily Journal: it counts people (walk-in visits × party size) and can be replaced by a clicker count. This report counts visits, including phone and online ones, and never reads door traffic |
| An amber box "About the numbers in this range" appears above the tabs | Part of the report could not be loaded, or the range holds more than the report reads at once (10,000 visits, 10,000 different items, 10,000 asks or 5,000 complaints). Reload the page, or pick a shorter range |
| Requested items looks short | Only asks where Did you have it? was answered No on the visit appear. That is the definition of "requested, not stocked" |
| There is no Location filter | It only appears when your store has more than one location |
| Gross margin doesn't change when I filter | Gross margin always covers the whole store. Its caption then reads "All locations and staff — margin comes from the P&L" |
| Open Replenish opens the Import tab | Your store has no purchase order yet, so New Order is locked. The notice at the top of that page says so. Import is where the first purchase order is created; the other three tabs unlock after it. See Inventory → Procurement |
| A note says "No store time zone is set…" | Set Business Timezone in Settings → Organization, which is where the note points |
| "403 - Forbidden" when opening the report | Lost sales is hidden from your menu. Ask your owner to show it again in Settings → Team |
What's next
- Buy what was asked for: Inventory → Procurement
- Keep the log going: Sales → Walk-ins
- Fix the repeats: Growth → Complaints
Detailed reference
Every button, icon, field and message on this page, for when you need the exact detail. Each panel starts closed — open the one you need.
Page header and toolbar
| Control | Where | What it does | Notes |
|---|---|---|---|
| Title Lost sales report | Header | Page heading. Subtitle: "Walk-in conversion over time, lost-sale reasons, what people asked for and complaint categories, alongside sales and margin." | — |
| Demo (Play icon) | Header, right | Opens the report on sample data. The guided tour starts by itself the first time | Always shown, even while the report loads. See Demo mode below and Demo mode |
| Export CSV (download icon) | Header, far right | Opens the Export CSV menu (see Menu: Export CSV) | Only ready when the report on screen answers the filters on screen. Greyed out until the first load, while a Visits export runs (the icon turns into a spinner), while the report reloads after a filter change ("Reloading for these filters…"), and after a refresh that failed ("Load the report again before exporting"). Hover the button to read why |
Filter row (above the tabs, shared by every tab)
| Control | Where | What it does | Notes |
|---|---|---|---|
| Last 30 days | Filter row, first chip | Range = the last 30 days in store time, today included | The default. The selected chip is filled dark |
| Last 90 days | Filter row, second chip | Range = the last 90 days in store time, today included | — |
| This year | Filter row, third chip | Range = 1 January of this year to today | — |
| From (calendar icon, then the date, e.g. "Sep 1, 2026") | After the chips | Opens a one-month calendar with previous and next arrows. Picking a day sets the start of a custom range straight away | No chip is highlighted after a custom pick. If the new From is after To, To moves to the same day. Days after today are greyed out. Appears once the store's date has loaded |
| To (calendar icon, then the date) | After From | Same calendar. Sets the end of a custom range | If the new To is before From, From moves to the same day. Days after today are greyed out and can't be picked: a day that hasn't happened has no visits, so counting it would only lower Coverage · visits per open day. A link with a future date in it is pulled back to today |
| Location (All locations or one location) | Filter row | Narrows visits, requested items, reasons, conversion, sources, complaints, seasonality, orders and revenue to one location | Only shown when the store has more than one location. Gross margin stays store-wide. If the location list can't be read, the select doesn't appear |
| Staff (All staff or one team member) | Filter row | Narrows visits, conversion, reasons, sources, seasonality, orders and revenue to one person | A visit counts for the person who handled it. If nobody was set as the handler, it counts for whoever logged it. Orders count for the person who wrote them. Does not narrow Requested items, Gross margin or Complaints |
| Note "The staff filter narrows visits, conversion, seasonality and orders. Requested items, complaints and gross margin still cover the whole team." | Under the filter row | Reminds you what the staff filter leaves whole-team | Shown while a staff member is picked |
| Updating… (spinner) | Right end of the filter row | Shows while the report reloads after a change. The tab content fades and can't be clicked until the reload finishes | Only after the first load. The first load shows grey placeholder boxes instead |
Tab bar
| Control | Where | What it does | Notes |
|---|---|---|---|
| Overview (bar-chart icon) | Tab bar, 1st | Shows Overview | The default tab |
| Requested items (package icon) | Tab bar, 2nd | Shows Requested items | — |
| Reasons (door icon) | Tab bar, 3rd | Shows Reasons | — |
| Conversion (percent icon) | Tab bar, 4th | Shows Conversion | — |
| Sources (compass icon) | Tab bar, 5th | Shows Sources | — |
| Complaints (speech-bubble warning icon) | Tab bar, 6th | Shows Complaints | — |
| Seasonality (calendar icon) | Tab bar, 7th | Shows Seasonality | — |
Page states and links
| Control | Where | What it does | Notes |
|---|---|---|---|
| Grey placeholder boxes | Tab area | Stand in for the numbers during the first load | — |
| "The report could not be loaded." + the reason + Retry (circular-arrows icon) | Tab area | Retry loads the report again | Only when the first load failed |
| Red strip "Could not refresh for these filters — showing the last numbers loaded. …" + Retry | Between the filters and the tabs | Retry runs the reload again | The numbers on screen are still for the previous filters |
| Amber box "About the numbers in this range" | Between the filters and the tabs | Lists each part that failed to load or was cut short (texts under Messages you may see) | The rest of the report still shows |
Address ending ?from=2026-08-01&to=2026-08-31 | Browser address bar | Opens the report on that custom range | Reversed dates are swapped. An invalid date opens Last 30 days. The dashboard and the Sales Report link in this way |
Address ending ?tab=requested | Browser address bar | Opens that tab. Values: overview, requested, reasons, conversion, sources, complaints, seasonality | Anything else opens Overview. Clicking tabs and filters doesn't change the address, so a copied address doesn't keep your current view |
Tab: Overview
When the range has no visits, no lost sales and no requested items, the whole tab shows "No visits logged in this range." / "Log visitors on Walk-ins — nothing to install. One tap per visitor, the reason if they leave empty-handed, and this report fills itself in." with an Open Walk-ins link.
KPI row (five cards)
| Control | Where | What it does | Notes |
|---|---|---|---|
| Visitors logged + info icon (i) | KPI row, 1st | Visits logged in the range. Caption "Logged by your team, not measured". Tooltip: "Count of logged visits in the range. Logged by your team, not measured." | Counts walk-in, phone and online visits. Leaves out lost-sale records made from a lost quote or from the order form |
| Walk-in conversion + (i) | KPI row, 2nd | Visits that ended Sold or Special order ÷ visitors logged, as a %. Tooltip: "Visits that ended Sold or Special order ÷ visitors logged. Estimated from what your team logged." | Caption "Estimated from what your team logged" with its own (i): "Estimated from what your team logged. UpChannels does not count foot traffic — no camera, no door sensor." A quote doesn't count as sold. "—" with no visitors |
| Lost sales · … buyable + (i) | KPI row, 3rd | Big number = visits that ended Left. The label carries the buyable count. Caption "Buyable = a purchase order can fix it". Tooltip: "Left visits whose reason is in the Buyable class. The part a purchase order can fix." | Turns amber when the buyable count is above 0. Includes lost-sale records made from lost quotes or the order form |
| Est. value of buyable asks + (i) | KPI row, 4th | Asks × current list price, added up over the requested items. Shortened: exact under $10,000, then "$41k", "$1.2M". Tooltip: 'Wants where "had it" was No, grouped by item and ranked by asks; est. value = asks × current list price. Value is indicative.' | Caption "Indicative: asks × current list price", or "Indicative · … asks not priced (free text or no list price)" when some asks have no price. Free-text asks and products with no list price are left out of the total |
| Coverage · visits per open day + (i) | KPI row, 5th | Visitors ÷ open days, shown like "13.7 / day". Caption "… visits over … open days". Tooltip: "Visits logged per open day, per location and per staff member. The number to chase first." | A day is open unless the location's opening hours mark it closed. Locations without hours count every day. With All locations, a day counts if any location is open. Only days that have happened count, so a range running past today is pulled back to today and the caption adds ", counted through" and today's date. "—" and "No open days in this range" with no open days |
Alongside sales and margin (four grey cards)
| Control | Where | What it does | Notes |
|---|---|---|---|
| Heading "Alongside sales and margin" | Below the KPI row | — | If sales can't be read, "Sales figures could not be loaded for this range." appears on the right and the cards show "—" |
| Sales made | Sales row, 1st | Sales made on these days: a sale on the day it was entered, a converted quote on the day it was accepted (the Orders list files that quote under the day it was written). Caption "Sales made on these days" | Location and staff filters apply. Over 13 months the caption reads "First 13 months only, through …" |
| Revenue | Sales row, 2nd | The money received on sales on these days, less refunds, whatever the order's status. Caption "Avg. sale $…", the average counted sale (Completed, Delivered or Shipped) made on these days, less anything returned on it (not revenue) — the Dashboard's Avg sale rule | Caption "Money received on sales, less refunds" when there are no counted sales. The location and staff filters are the sale's own: the location it belongs to and the person who filed it. With no filter it is the Dashboard's figure for the same days. Hover (question mark): what the figure counts. When the days reach back before your store switched to counting revenue as the money received, a line under the row says so |
| Gross margin | Sales row, 3rd | Gross margin % from the Profit & Loss for the same days. Caption "From the P&L for the same days" | Always store-wide. With a location or staff filter the caption reads "All locations and staff — margin comes from the P&L". "—" when the P&L has no revenue for the days. Unavailable with the caption "The Profit & Loss could not be read for these days" when the read itself failed — the other three cards still hold their figures, and the reason is listed under "About the numbers in this range". Over 13 months the caption reads "First 13 months only, through …" |
| Sales made ÷ visitors + (i) | Sales row, 4th | Every sale made on these days ÷ visitors logged. Tooltip: "Alternative view: every sale made on these days (a quote on the day it was accepted) ÷ visitors logged. Orders from phone, web or repeat customers who were never logged push it up." | Caption "Estimated from what your team logged". Over 13 months it shows "—" with "Not shown: orders stop 13 months in, visitors do not" |
| Note "Order figures cover at most 13 months from the start of a range. Pick a shorter range to compare them with the visitor counts." | Under the sales row | — | Only on a custom range longer than 13 months |
| Note "No store time zone is set, so walk-in days are counted in UTC and order days in this browser’s zone — the two can differ by a few hours at each end. Set Business Timezone under Settings › Organization." | Under the sales row | — | The field is on the Organization tab of Settings |
Panels
| Control | Where | What it does | Notes |
|---|---|---|---|
| Panel "Asked for, not in stock" | Left | Top 5 requested items as amber bars with ask counts. Subtitle "Ranked by asks · items staff marked “didn’t have it” — the part a purchase order can fix" | Free-text asks show in quotes. Hover: "… — free text, not mapped to a product yet". Empty: "Nothing asked for that you didn’t have in this range." |
| All requested items (arrow) | "Asked for, not in stock", top right | Switches to the Requested items tab | Only when at least one item is listed |
| Panel "Reasons a visit ended without a sale" | Right | Top 6 reasons as bars, each with its share of Left visits. Amber bar = buyable reason. Subtitle "Amber = a purchase order can fix it · share of visits that ended Left" | Hover: the reason and its class. Empty: "No visits ended as Left in this range." |
| Reasons (arrow) | Reasons panel, top right | Switches to the Reasons tab | Only when at least one visit ended Left |
Tab: Requested items
Empty state: "Nothing asked for that you didn’t have in this range." / "When a visitor asks for an item you are out of, add it to their visit on Walk-ins and answer “had it?” with No. It lands here, ranked by how often it was asked for." with an Open Walk-ins link.
| Control | Where | What it does | Notes |
|---|---|---|---|
| Panel "Asked for, not in stock" and its subtitle | Top of tab | Subtitle: "… items · … asks · … waiting for a text · est. value $… (indicative: asks × current list price)" | "waiting for a text" only appears when above 0. With a staff filter it adds " · whole team: asks are not split by staff member" |
| Open Replenish (arrow, blue link) | Panel, top right | Opens Inventory → Procurement Orders on the New Order tab, where Requested, not stocked and Add to PO are | If the store has never created a purchase order, New Order is locked and the page shows Import instead, with a notice naming the tab you asked for and why it is not open yet. See Procurement |
| Column # | Table | Rank, most asks first | No column can be re-sorted |
| Column Item | Table | Product name (with its option) and the SKU underneath | Free-text asks show in quotes with an outlined Free text badge. "… units asked" appears when people asked for more units than there were asks. Long names are cut off; hover for the full name |
| Column Asks | Table | Times the item was asked for and not in stock | — |
| Column Distinct visitors | Table | How many different visitors asked | — |
| Column Waiting for a text | Table | Asks still waiting for a back-in-stock text | Amber when above 0 |
| Column Available now (Available here / elsewhere with a location picked) | Table | All locations: "… in stock now" plus a line naming the locations that have stock ("Oak St 3 · Main 1"). One location: "… here" plus "Elsewhere: …" | Green when above 0. Free-text asks show "Not in catalog". Oversold stock shows as 0. A deleted location shows as "Other location" |
| Column Est. value + (i) "About est. value" | Table | Asks × current list price | "—" for free text or no list price. Tooltip: 'Wants where "had it" was No, grouped by item and ranked by asks; est. value = asks × current list price. Value is indicative.' |
| Column Last asked | Table | Date of the latest ask, like "Sep 12" (store time) | "—" if unknown |
| Footnote | Under the table | "Free-text asks (in quotes) are grouped by their normalised text until they are mapped to a product, so “chest freezer” and “Chest Freezer ” count together but “7 cu ft freezer” is its own row. Est. value uses today’s list price and leaves free-text asks out — it is a size of the opportunity, not a forecast." | — |
| Rows | Table | Rows can't be clicked and have no menu | — |
Tab: Reasons
Empty state: "No visits ended as Left in this range." / "When a visitor leaves without buying, tap Left on their visit and pick a reason. Reasons are short and editable in Settings → Lost sales." with an Open Walk-ins link.
| Control | Where | What it does | Notes |
|---|---|---|---|
| Buyable card (amber) | Top left | Buyable share of Left visits, then "… visits · a purchase order can fix it" | — |
| Not buyable card | Top right | Everything else, as a share, then "… visits · price, timing, financing, browsing, service" | — |
| Panel "Buyable vs price vs timing" | Left | Donut chart of Left visits by reason class. Subtitle "Left visits by reason class · … in this range". The legend below shows each class with "count · %" | Classes: Buyable (amber), Price, Timing, Financing, Browsing, Service, Other. Each class keeps its own colour. Hover a slice for its numbers. A reason no longer in your list counts as Other |
| Panel "Every reason, share of Left" | Right | Every reason as a bar with its share of Left visits, most common first. Amber = buyable. Subtitle "Amber = a purchase order can fix it · reasons and classes come from Settings → Lost sales" | Hover: the reason, its class and "… visits" |
Reasons and their classes come from Settings → Lost sales, so an owner's edits there relabel and reclassify this tab. Most retail stores start with: Out of stock, Wrong size and Wrong finish / color (Buyable), Price (Price), Delivery timing (Timing), Financing (Financing), Just looking (Browsing) and Nobody free to help (Service). Apparel shops, service businesses and restaurants start with their own lists.
Tab: Conversion
Empty state: "No visits logged in this range." / "Log visitors on Walk-ins — nothing to install. Conversion here is sold ÷ visitors your team logged, so it only means something once the team logs most of the day." with an Open Walk-ins link.
| Control | Where | What it does | Notes |
|---|---|---|---|
| Panel "Conversion over time" | Top, full width | Grey bars "Visitors logged" and green bars "Sold" (left axis), blue line "Conversion % (estimated)" (right axis). Subtitle "Visitors logged and sold by day (or week, or month), with sold ÷ visitors · Estimated from what your team logged" + (i) | Hover for the values. The legend can't be clicked |
| Day / Week / Month chips | "Conversion over time", top right | Change how the chart groups days | Day is offered for ranges up to 92 days, Week from 14 days, Month from 62 days. Hidden when only one fits. Starts on Day up to 31 days, Week up to 120 days, Month beyond. Weeks start on Sunday ("Wk of Mar 1") |
| Gap note "… days have no visitors logged, so the line breaks there — it is not a 0% day." | Under the chart | Explains breaks in the line | Says weeks or months when grouped that way |
| Panel "Conversion by weekday" | Middle left | Mon to Sun bars: sold ÷ visitors logged, %. Subtitle "Sold ÷ visitors logged, % · Estimated from what your team logged". Below: "Visitors logged: Mon … · Tue … …" | Hover a bar for "Conversion % (estimated)". Empty: "No visits logged in this range." |
| Panel "Conversion by hour" | Middle right | One bar per hour in store time ("9am", "5pm"), from the first busy hour to the last. Subtitle "Visits logged live only, store time, % · Estimated from what your team logged". Below: "Visitors logged: 9am … · …" | Hover a bar for "Conversion % (estimated)". Only visits logged live. Notes may follow: "… end-of-day entries not shown by hour — their times are approximate.", "… lost-sale records from quotes or the order form are not visits at a time of day.", "Only the newest visits in this range are included." Empty: "No visits were logged live in this range, so there is nothing to place by hour." |
| Panel "By location" | Bottom left | Columns Location, Visitors, Per open day + (i) "About coverage", Sold, Left, Conv. + (i) "How conversion is estimated". Subtitle "Coverage and conversion · Estimated from what your team logged" | Every active location is listed, including ones with no visits. Most visitors first, then by name. Open days stop at today, the same as the Coverage card. Hover a Per open day cell: "… open days, … days with visits logged". With a location picked, only that location. A deleted location shows as "Other location". Empty: "No visits logged in this range." |
| Panel "By staff · coverage vs closes" | Bottom right | Columns Staff, Logged + (i) "Visits this person handled, plus the ones they entered with nobody named as the handler — coverage, the number to grow first.", Sold, Conv. + (i) "How conversion is estimated". Subtitle "Conversion · Estimated from what your team logged". Footnote: "Someone who logs every visitor shows a lower rate than someone who logs only buyers — read Logged first." | Most visits first, then by name. Not recorded (nobody set) is always last. People who typed visits in but handled none show with 0. A removed user shows as "Former team member". Hover a name: "… visits typed in by …" when that differs from Logged |
| Footer note | Bottom of tab | "Track these against your own baseline month over month. Published specialty-retail ranges are directional only, and this report sets no target." | — |
Tab: Sources
Empty state: "No visits logged in this range." / "Log visitors on Walk-ins — nothing to install. Pick where they came from on the visit (drove past, Google, a referral…) and this tab shows which sources bring buyers." with an Open Walk-ins link.
| Control | Where | What it does | Notes |
|---|---|---|---|
| Panel "Visits and conversion by source" | Tab | Subtitle "Conversion · Estimated from what your team logged" + (i) | — |
| Column Source | Table | Where the visitor said they came from, from your store's list in Settings → Lost sales. Most stores start with Drove past, Google, Facebook ad, Referral, Repeat customer, Website and Other; apparel shops and restaurants get a slightly different list | Every source in the list is shown, even with 0 visits. A source you've hidden shows only when it has visits. Not recorded (grey) = visits with no source picked; always shown, always last |
| Column Share of visits | Table | Bar and % of visits | Blue bar; grey for Not recorded |
| Column Visits | Table | Visits from that source | Rows sorted by visits. Lost-sale records from quotes or the order form aren't counted |
| Column Sold | Table | Of those, visits that ended Sold | — |
| Column Conv. + (i) "How conversion is estimated" | Table | Sold ÷ Visits | — |
| Footnote | Under the table | "Source is what the visitor told staff, picked on the visit — the same list as the customer form’s “customer source”." | Adds "… visits have no source yet; asking “how did you hear about us?” at the counter fills this in." when some have none, and "Only the newest visits in this range are included." past 10,000 visits |
Tab: Complaints
Counts, not estimates: this tab has no estimate caption. Complaints are counted by the day they were opened. The location filter applies; the staff filter does not.
Empty state: "No complaints logged in this range." / "Log one the moment somebody tells you about it — category, severity, owner, a line about what happened. A single complaint tells you nothing; three months of them tell you what to fix." with an Open Complaints link.
| Control | Where | What it does | Notes |
|---|---|---|---|
| Amber alert "This range has more complaints than the tab reads at once: the tables cover the most recent ones. Pick a shorter range." | Top of tab | — | More than 5,000 complaints in the range |
| Complaints | KPI row, 1st | Complaints opened in the range | — |
| Still open | KPI row, 2nd | Complaints not yet resolved or closed | — |
| Overdue | KPI row, 3rd | Open complaints past their answer-by day, as of the moment the tab is shown. Caption "Past the answer-by day set in Settings" | Amber when above 0. Answer-by days per severity are set in Settings → Lost sales |
| Median time to settle | KPI row, 4th | Middle time from opened to resolved or closed, over settled complaints ("4 min", "2 h", "1 d 23 h"). Caption "Half were faster, half slower" | "—" when none are settled |
| Settled in time | KPI row, 5th | % of settled complaints settled by their answer-by day. Caption "Of the ones that are done" | "—" when none are settled |
| Panel "What people complain about" | Below the KPIs | One bar per category, by count. Amber bar = that category has something overdue. Subtitle "Amber marks a category with something overdue in it. The categories are yours — edit them in Settings › Lost sales." | Hover: "… complaints · … open · … overdue" |
| Panel "By category" | Left | Columns Category, All, Open, Overdue (amber above 0), Median. Subtitle "How each one behaves, not just how often it happens." | Only categories with complaints, most first. Most retail stores start with: Delivery window, Damaged on arrival, Product defect, Wrong item, Pricing / billing, Staff / service, Install / service quality, Communication, Other. Other business types start with their own list |
| Panel "By severity" | Right | Columns Severity (Low, Normal, High, Urgent, Emergency), All, Overdue (amber above 0), Median. Subtitle "Severity sets the answer-by day, so this is where a missed promise shows." | Only severities with complaints, most first |
| Panel "Who is carrying them" | Bottom | Columns Owner, All, Open, Overdue (amber above 0), Median. Subtitle "Load, not blame: someone with every overdue complaint needs help, not a talking-to." | Most complaints first. No owner shows as grey "Nobody yet". A removed user shows as "Former teammate" |
Tab: Seasonality
Empty state: "No asks for items you didn’t have in this range." / "Every ask staff log as “didn’t have it” is counted by the month it was asked. Over a season the pattern shows itself — pick This year once a few months are logged." with an Open Walk-ins link.
| Control | Where | What it does | Notes |
|---|---|---|---|
| Panel "Asks per month, top items" | Top | One line per top-5 requested item: asks per month, in store time. Subtitle: "What people asked for and you did not have, by the month they asked — the chest-freezer questions that start in May, the space heaters that start in October. Observed asks, not a forecast." | Hover for the values; the legend can't be clicked. The staff filter does apply here, unlike Requested items |
| Note "This range covers one month. Pick 90 days or This year to see months side by side." | Under the chart | — | When the range covers fewer than two months |
| Panel "Month by month" | Bottom | Table: Item (with a dot in its line's colour), one column per month ("Sep 2026"), Total | Subtitle "Top … items." or "Top … items; … other items are counted in Other." A grey Other row appears when more than 5 items were asked for. Every month in the range is listed, including empty ones |
Menu: Export CSV
| Control | Where | What it does | Notes |
|---|---|---|---|
| Caption "For the range and filters shown" | Menu, top | Can't be clicked | The export follows the range, location and staff you have set. The menu cannot be opened while those differ from the report on screen, so a file can never be the previous filters' |
| Requested items | Menu item | Downloads the ranked "asked for, not in stock" list as lost-sales_requested-items_2026-08-01_2026-08-31.csv (the range's first and last day). Toast "Exported … requested items." | Always the whole team, even with a staff filter. Nothing downloads when the list is empty: toast "Nothing asked for that you didn’t have in this range." |
| Visits | Menu item | Reads every logged visit for the range and filters and downloads lost-sales_visits_2026-08-01_2026-08-31.csv, oldest first. Toast "Exported … visits." | Staff filter: visits the person handled, plus visits they typed in with nobody set as handler. A busy day is exported in full, however many visits it holds, and the count in the toast is exact. A file holds 20,000 rows at most: above that you get the NEWEST 20,000 (still oldest first inside the file) with a warning toast naming both numbers, and shortening the range, or picking a location or a person, reaches the rest. A single month holding more than 50,000 visits is the one case where the number it names is a floor, and the toast then says "more than" rather than an exact count. Empty: toast "No visits logged in this range to export." Failure: "Export failed: …" or "Export failed." |
Requested items file columns: Rank, Item, SKU, In catalog (Yes or No), Asks, Quantity asked, Visitors, Waiting for a text, Available now, Available by location ("Name: 3; Name: 1"), List price, Est. value (asks x list price, indicative), First asked, Last asked. Dates are in store time. Stock reads as it does on the screen: Available now shows an oversold item as 0, and Available by location lists only the locations that have some.
Visits file columns: Date, Time (24-hour, store time), Location, Channel (Walk-in, Phone or Online), Asked for (items separated by "; "), Had it (Yes or No per item, same order), Outcome (Open, Sold, Quote, Special order or Left), Reason (Left visits only), Source, Handled by (whoever logged the visit when nobody was set as handler), Party size, Entry ("Live", "End of day (time approximate)" or "From a lost quote or order"). A removed user shows as "Former team member", a removed location as "Other location".
Both files are UTF-8 so Excel shows accents and dashes correctly. A text cell that starts with =, +, -, @ or a tab gets a leading apostrophe, so spreadsheet apps show it as text and never run it as a formula. That is why some item names start with an apostrophe.
Links into this report
| Control | Where | What it does | Notes |
|---|---|---|---|
| Lost sales (trend-down icon) | Sidebar, Reports | Opens the report on Last 30 days | — |
| Lost sales this week card | Dashboard, operational cards | Opens the report on Sunday to today, the days the card counted | Big number = buyable lost visits this week; hint "… lost · … buyable" |
| Conversion card | Dashboard, KPI scorecard | Opens the report on Last 30 days | — |
| "Walk-ins in this range: … visitors · …% conversion (estimated from what your team logged)" + Lost sales report (arrow) | Sales Report | Opens this report on the Sales Report's days | Other texts: "none logged. Log visitors on Walk-ins — nothing to install." and "Walk-in numbers could not be loaded." Hover: "Walk-in days … – … (store time)" |
| See requested items (arrow) | Product page, walk-in requests card | Opens this report on the Requested items tab | — |
Messages you may see
| Message | When it appears | What to do |
|---|---|---|
| "Exported … requested items." | Export CSV → Requested items downloaded | — |
| "Nothing asked for that you didn’t have in this range." (toast) | Export CSV → Requested items with an empty list | Widen the range. Asks only count when Did you have it? was No |
| "Exported … visits." | Export CSV → Visits downloaded, with every visit in the range in it | — |
| "Exported the newest 20,000 of … visits. Narrow the date range or filters to export them all." | Export CSV → Visits, when the range holds more than 20,000 visits | The file has the newest 20,000. Shorten the range, or pick a location or a person, and export again for the rest |
| "Exported the newest 20,000 of more than … visits. Narrow the date range or filters to export them all." | Same, but a single month in the range held more than 50,000 visits, so the number named is a floor | The file still has the newest 20,000. Shorten the range, or pick a location or a person |
| "No visits logged in this range to export." | Export CSV → Visits with no visits | Widen the range or clear the filters |
| "Export failed: …" / "Export failed." | The Visits export couldn't read the visits | Try again, or pick a shorter range |
| "The report could not be loaded." + a reason (for example "Organization not found." or "Something went wrong.") + Retry | The first load failed | Click Retry or reload the page. Check you're signed in to the right store |
| "Could not refresh for these filters — showing the last numbers loaded. …" + Retry | A reload after a filter change failed | Click Retry. Until then the numbers are for the previous filters |
| "About the numbers in this range" with "Visit details could not be loaded: …" (or Requested items, Seasonality, Sales for this range, Complaints) | That part failed. Everything else still shows, and that part is empty | Reload the page or change a filter |
| "More than 10,000 visits in this range: totals cover the newest ones. Pick a shorter range." | A staff member is picked and they have over 10,000 visits in the range | Pick a shorter range |
| "More than 10,000 different items were asked for in this range: the list and the estimated value cover the most-asked ones. Pick a shorter range." | The requested list was cut short | Pick a shorter range |
| "More than 10,000 asks in this range: Seasonality counts the most recently logged ones, so earlier months read low. Pick a shorter range." | Seasonality was cut short | Pick a shorter range |
| "More than 5,000 complaints in this range: the Complaints tab counts the most recent ones. Pick a shorter range." | Complaints were cut short (the Complaints tab also shows its own amber alert) | Pick a shorter range |
| "Only the newest visits in this range are included." | Conversion by hour and Sources, past 10,000 visits | Pick a shorter range |
| "Sales figures could not be loaded for this range." | The sales cards couldn't be read; they show "—" | Reload the page |
| "Order figures cover at most 13 months from the start of a range. …", "First 13 months only, through …", "Not shown: orders stop 13 months in, visitors do not" | A custom range longer than 13 months | Pick 13 months or less |
| "No store time zone is set, so walk-in days are counted in UTC and order days in this browser’s zone … Set Business Timezone under Settings › Organization." | No Business Timezone is set | An owner sets Business Timezone in Settings → Organization |
| "The staff filter narrows visits, conversion, seasonality and orders. Requested items, complaints and gross margin still cover the whole team." | A staff member is picked | For information |
| "No visits logged in this range." | Overview, Conversion or Sources with no visits | Log visits on Walk-ins |
| "Nothing asked for that you didn’t have in this range." | Requested items (or the Overview panel) with no asks marked No | Add asks to visits on Walk-ins |
| "No visits ended as Left in this range." | Reasons (or the Overview panel) with no Left visits | — |
| "No complaints logged in this range." | Complaints tab with none | Log complaints on Complaints |
| "No asks for items you didn’t have in this range." | Seasonality with no asks | — |
| "No visits were logged live in this range, so there is nothing to place by hour." | Conversion by hour when every visit was typed in later | Log visits live to see hours |
| "… days have no visitors logged, so the line breaks there — it is not a 0% day." | Conversion over time with gaps | For information: a gap in the log, not a day with no sales |
| "… end-of-day entries not shown by hour — their times are approximate." / "… lost-sale records from quotes or the order form are not visits at a time of day." | Conversion by hour | For information |
| "This range covers one month. Pick 90 days or This year to see months side by side." | Seasonality on a range under two months | Widen the range |
| "Estimated from what your team logged" | Next to every conversion number | For information. Its (i) reads "Estimated from what your team logged. UpChannels does not count foot traffic — no camera, no door sensor." |
| "—" in a card | Nothing to divide by: no visitors, no open days, no settled complaints, or no P&L revenue | — |
| "Unavailable" in the Gross margin card | The Profit & Loss could not be read for these days | Different from "—", which means the read worked and there was simply no revenue. Reload the page or change a filter, or open Reports → Profit & Loss |
| "403 - Forbidden" / "You do not have permission to view this page. Contact your organization owner." | Lost sales is hidden from your menu, in a store with more than one active person | The owner shows it again in Settings → Team |
Colours: an amber card means buyable lost sales or overdue complaints above 0. An amber bar means a buyable reason, or a complaint category with something overdue. Amber numbers mean texts waiting or overdue complaints. Green stock means it's available now.
Who can use what
| Topic | What happens |
|---|---|
| Plan | Every plan. No plan badge in the sidebar. Gross margin shows here even on a plan without the Profit & Loss page |
| Role | The page itself has no owner or manager check. Anyone who can open it sees the whole report, including every person's row under By staff |
| Menu visibility | In a store with more than one active person, the owner can hide Lost sales from someone's menu in Settings → Team. That person then gets "403 - Forbidden" at the report's address. People switched off or removed in Team don't count towards that |
| Changes | None. The page only reads; Export CSV is a download |
| Settings → Lost sales | The owner only. The reason list and classes, sources, complaint categories and answer-by days set there feed this report. See Settings |
| Business Timezone | Settings → Organization, the owner only. It decides which day each visit falls on and what "today" is for the range buttons. Without it, walk-in days use UTC |
Demo mode (/reports/lost-sales/demo)
- Open it: Demo (Play icon), header right on the live page.
- Header: "Lost sales report — Demo", subtitle ending "Sample data; all actions are disabled."
- Banner: "Demo mode — report is populated with sample data. All actions are disabled." with Take the tour (question-mark icon), which restarts the tour from step 1. The tour also starts by itself the first time the demo opens.
- Disabled: Export CSV is always greyed out. Open Replenish is plain grey text. The Open Walk-ins and Open Complaints links in empty states are hidden.
- Still works: the range chips, From / To, Location, Staff, the tabs, Day / Week / Month, and the All requested items / Reasons buttons. They re-slice the sample data.
- Leave: Exit Demo Mode (back arrow), header right. It returns to the live report.
- Tour controls: progress dots and "… of 12", Back (from step 2), Skip (closes), Next, and Got it! on the last step. Keyboard: Esc closes, right arrow or Enter goes on (closes on the last step), left arrow goes back. Clicking the dark backdrop closes the tour. Each step switches to its tab first. If a step's target isn't on screen, the tour moves on to the next step.
| # | Tab | Tour step | What it points at |
|---|---|---|---|
| 1 | Overview | Seven views of one month | The tab bar. "Every tab reads the same range and location filter. This tour walks all of them, in the order the monthly review asks its questions." |
| 2 | Overview | Range, store, person | The filter row. "Days are your store's own days — the range follows your business time zone, not the browser's. Filter to one store or one person; requested items and complaints stay whole-team, and gross margin stays whole-store — it follows neither filter — and the report says so." |
| 3 | Overview | Estimated, and it says so | The five KPI cards. "Visitors, conversion, lost sales and coverage. Every conversion number carries "Estimated from what your team logged" — because that is exactly what it is. Nothing counts heads at the door." |
| 4 | Overview | Next to the money | The "Alongside sales and margin" row. "Orders and revenue for the same range and filters, so the walk-in numbers are read beside what the store actually took. Gross margin comes from the Profit & Loss for the range, which is whole-store: it does not narrow to a location or a person." |
| 5 | Requested items | The buying list | The requested-items table. "What people asked for and you did not have, ranked by asks, with how many are still waiting for a text. This is the list that goes on the next purchase order." |
| 6 | Reasons | What a purchase order can fix | The Buyable and Not buyable cards. "Reasons split into buyable — out of stock, wrong size, wrong finish — and everything else. Only the buyable share is a stocking decision; price and timing need a different answer." |
| 7 | Conversion | Your own trend | "Conversion over time". "Conversion over time, by weekday, by hour, by store and by person. Compare the store with itself: published retail ranges are directional at best." |
| 8 | Conversion | Coverage, not a scoreboard | "By staff · coverage vs closes". "Per-person conversion sits next to how many visits that person logged. Somebody who logs every visitor shows a lower rate than somebody who logs only buyers — read the Logged column first." |
| 9 | Sources | Where they came from | The sources table. "What visitors said when asked. "Not recorded" is shown, never hidden, so you can see how much of the answer is missing." |
| 10 | Complaints | Complaints, grouped | The complaint cards. "How many, how many still open, what is overdue, and the median time to settle. A median, not an average: one complaint left open for months should not colour the quarter." |
| 11 | Complaints | The repeat is the product | "What people complain about". "The categories that keep coming back are the ones worth a root cause. Amber marks a category with something overdue in it." |
| 12 | Seasonality | What only sells in one season | "Asks per month, top items". "Asks per month per item. A thing asked for every July is a stocking decision you can make in June." |
Step 1 says every tab follows the location filter, and step 4 says the sales row follows the filters. Gross margin is the exception: it stays store-wide under any location or staff filter.
Differences from the live page: the numbers are made-up sample data, the same on every load, and never your store's. Last 30 days always shows 412 visitors logged, 164 sold (40%, including the 36 special orders), 96 lost (49 buyable) and 13.7 visits per open day, with staff Marcus, Dana and Amy. The requested items, reasons and location names follow your business type: retail gets "Main showroom" and "Outlet store", service businesses get "Main shop" and "North branch". Days run on US Central time. There is no loading, error or warning state, the sales row never shows the 13-month or time-zone notes, and an address ending in a tab name doesn't open that tab.
Common questions
Why doesn't a quote count as a sale? A quote is an offer, not a purchase, so a visit that ended in one is neither sold nor lost here. A special order is different: the customer bought something the floor did not have, so it counts as a sale in walk-in conversion and in each person's Sold tally, and is also reported on its own. You can see every outcome in the Outcome column of the Visits export.
Why doesn't gross margin change when I pick a location or a person? Gross margin comes from the Profit & Loss for the whole store. With a location or staff filter, its caption changes to "All locations and staff — margin comes from the P&L". Sales made and Revenue do follow the filters.
Why is Export CSV greyed out? It stays greyed out until the report has loaded once, while a Visits export is running, while the report reloads after a filter change, and after a reload that failed. Hover the button to read which. On the demo page it is always greyed out.
Where are Last 7 days, This month and Last month? The range buttons are Last 30 days, Last 90 days and This year. For any other range, pick the first day in From and the last day in To.
Why does the hour chart show fewer visits than the other panels? Conversion by hour only uses visits logged live. Visits typed in at the end of the day have approximate times, and lost-sale records from quotes or the order form have no time of day. The notes under the chart say how many were left out.
Why does my best seller have the lowest conversion? Someone who logs every visitor shows a lower rate than someone who logs only the buyers. Read the Logged column first: it shows how much of the day each person actually recorded.
Why does the Requested items export ignore my staff filter? The requested-items list is always counted for the whole team, on screen and in the file. The Visits export does follow the staff filter.
Why does Open Replenish take me to Import? It opens Inventory → Procurement Orders on New Order. That tab stays locked until your store has created its first purchase order, so the page switches to Import, which is where that first order comes from.