Ads & Sales
Ads & Sales is the Google Ads Insights page. Open it from Growth → Ads Insights in the sidebar. It connects your store's Google Ads account and shows the numbers on two tabs. Weekly Reports puts your ad clicks, cost and conversions next to your own store revenue, sales orders, items sold and door traffic, week by week. Performance Comparison compares Google Ads numbers for two date ranges, two campaigns or two ad accounts. The page puts the numbers side by side. It does not calculate ROAS or ROI for you.
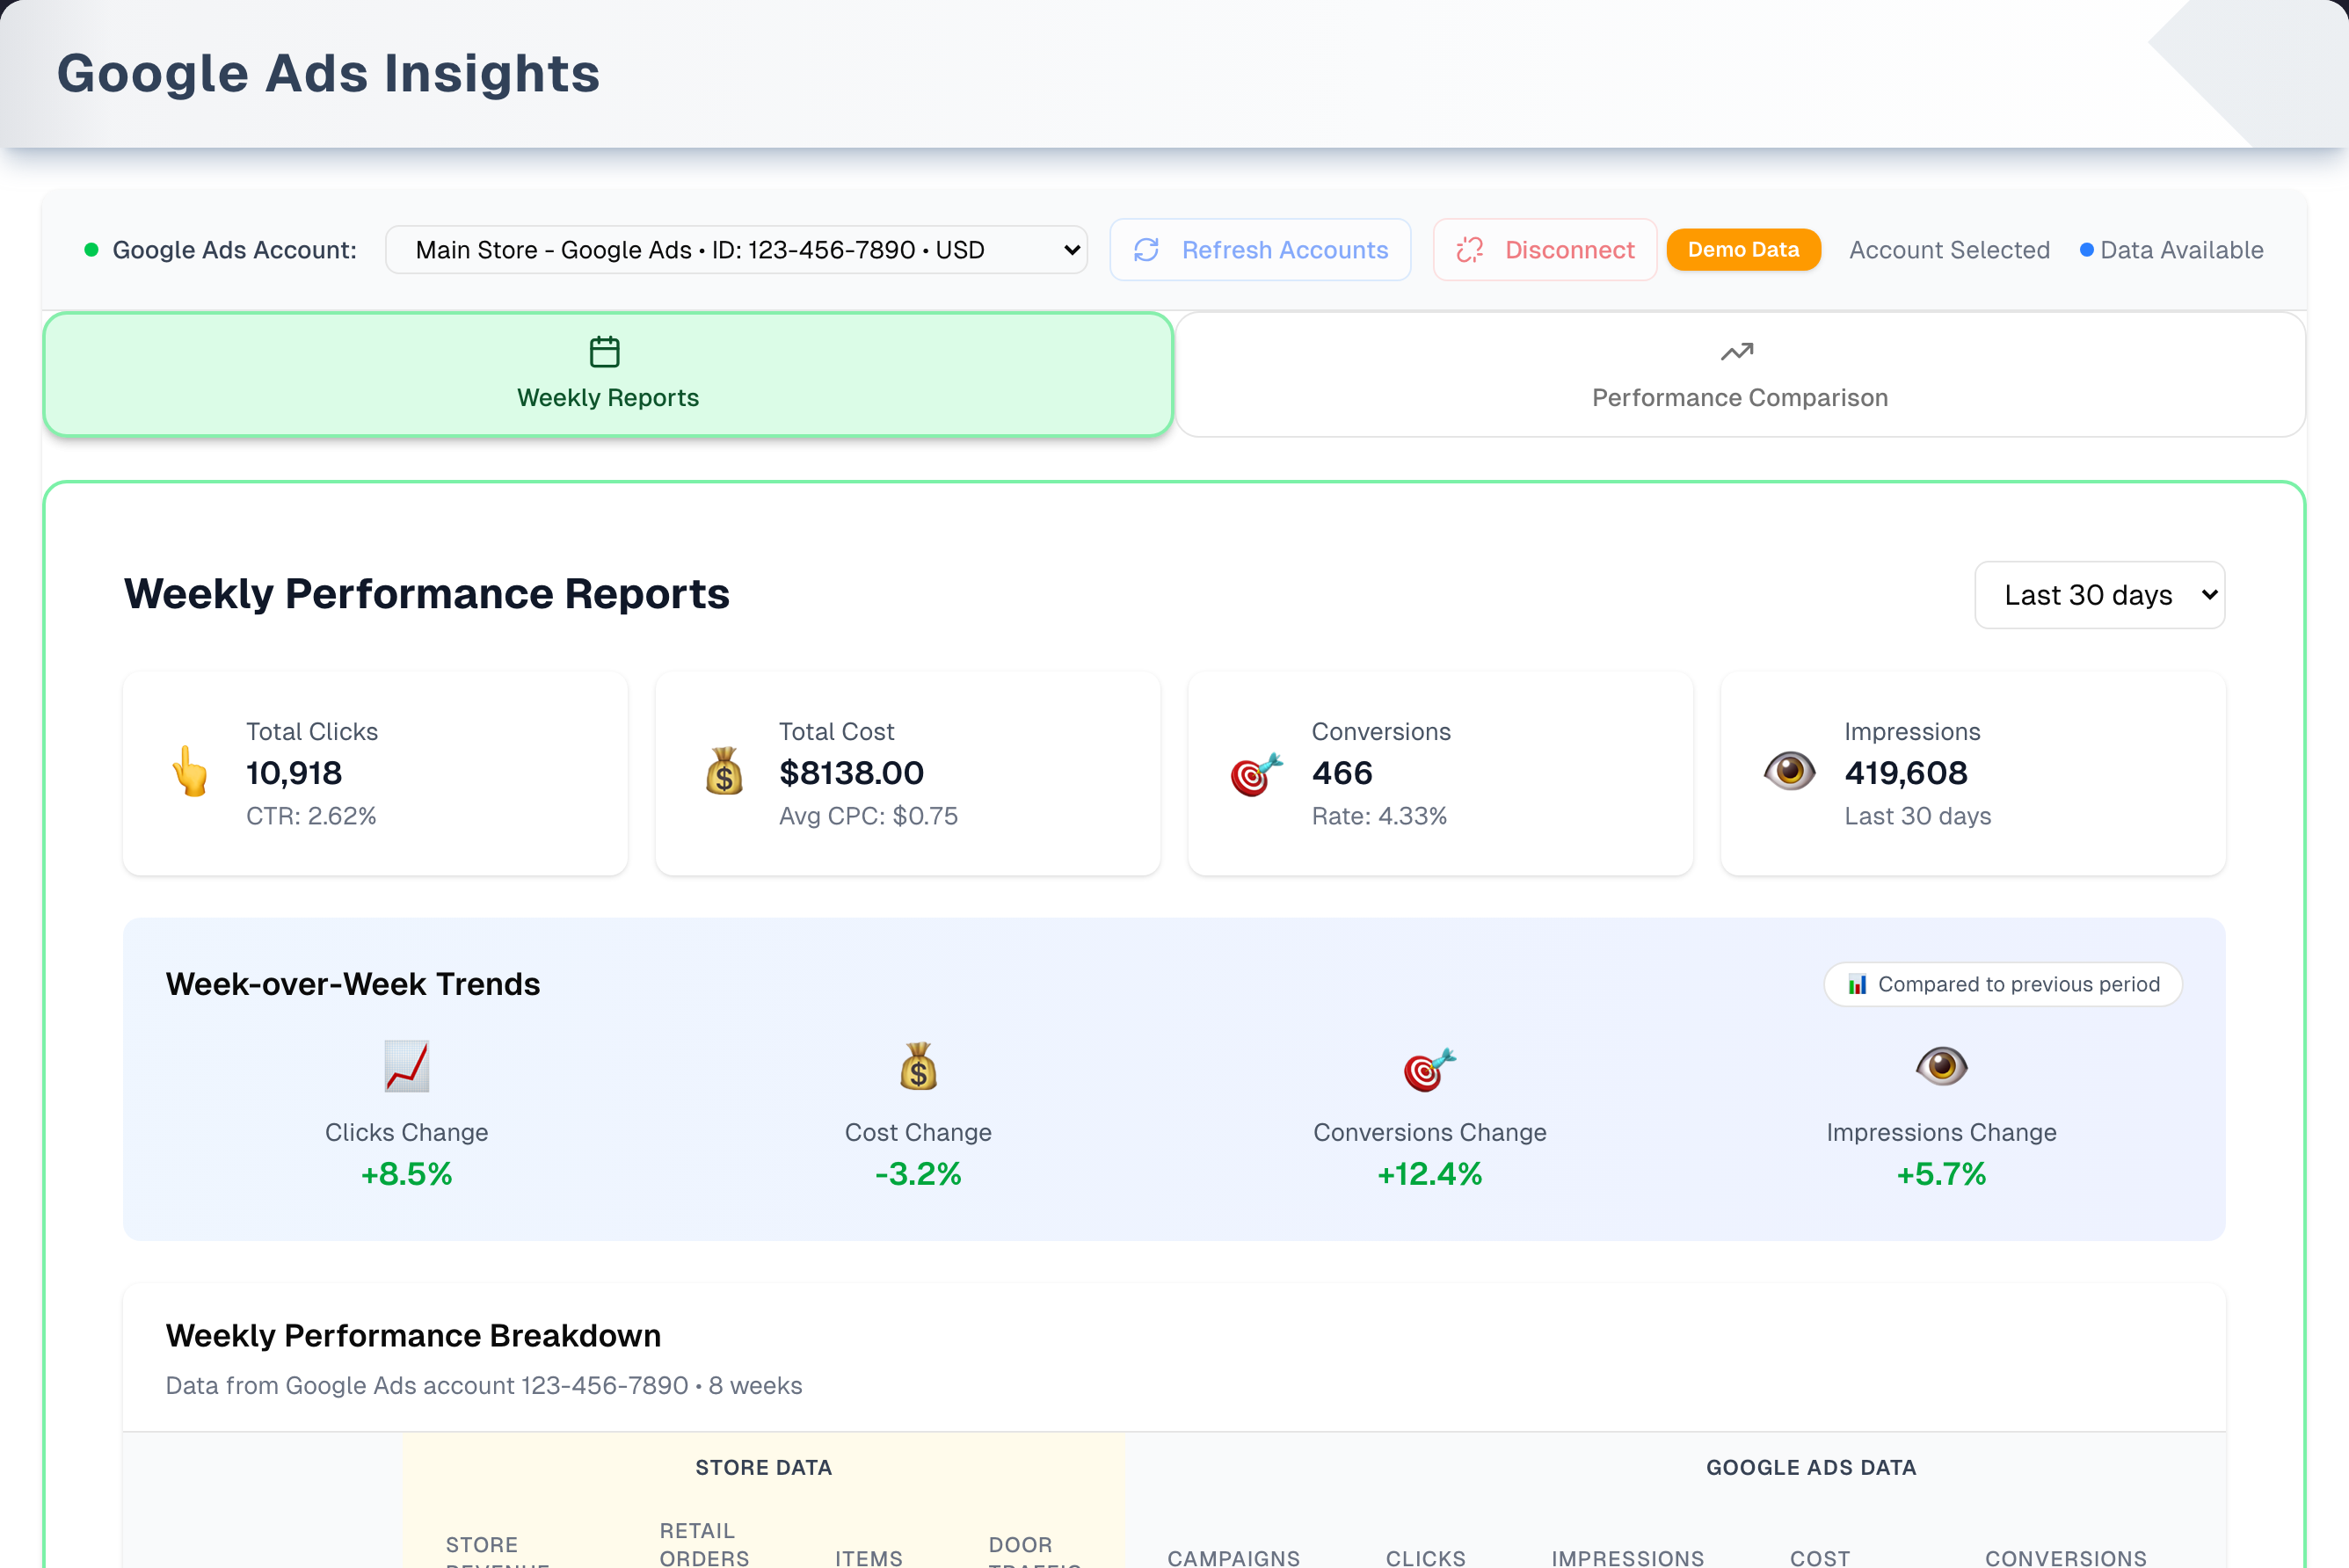
The screenshot is taken from the demo, so it shows sample data.
Overview
- One connection per store. Whoever connects signs in with their own Google login. Everyone in the store then sees the same ad accounts. Any team member can connect or disconnect, and Disconnect asks you to confirm first.
- Plan. Your real data needs Pro or Premium, or a free trial. On Basic the page shows sample data with a Demo Data badge and an Unlock Pro & Premium Features card, and the sidebar item has a small Pro tag.
- Loads on its own. Numbers reload when you change the account, the date range or a comparison pick, and again after Refresh Accounts brings back the account list. There is no Apply or Compare button.
- Read-only. No export, print, sorting or row clicks.
- Demo. The Demo button (top right) opens a sample-data copy with a 10-step guided tour. See Demo mode.
Connect Google Ads
- Open Growth → Ads Insights. The bar at the top reads Google Ads Account: Not Connected. Click Connect Google Ads Account.
- Google opens. Sign in with the Google login that can reach your ad account and allow access to your Google Ads and to your email address and basic profile. Finish within 10 minutes.
- The Google Ads Integration page reads "Google Ads account connected successfully!" and takes you back to Ads Insights after about 2 seconds.
- Pick your ad account in the dropdown. If you only have one, it's picked for you. Your choice is remembered in this browser.
If you click Cancel on Google's screen you come back to the Google Ads Integration page, which reads "You cancelled the Google sign-in, so nothing was connected. You can connect again whenever you like." Click Try Again there, or Return to Ads Insights. Every other way the return from Google can go wrong ends on that same page with a plain sentence.
Tabs in detail
Account bar
- The dropdown lists each ad account as "name • ID: … • currency", or "Currency unknown" when Google hasn't told us the account's currency. Changing it reloads the open tab.
- Refresh Accounts asks Google again for every ad account your connection can reach, then saves the new list for the store. Use it when an ad account is missing. Once the new list arrives, the open tab reloads its numbers too.
- Disconnect asks Disconnect Google Ads? first, and removes the store's connection for everyone only once you confirm. If it can't be removed, the page says why and the connection stays. To reconnect, click Connect Google Ads Account.
Weekly Reports
- Date range: Last 7 days, Last 14 days, Last 30 days (the default), This month, Last month.
- Summary cards: Total Clicks (with CTR), Total Cost (with Avg CPC), Conversions (with conversion rate) and Impressions.
- Week-over-Week Trends: the % change in clicks, cost, conversions and impressions from the week before to the last complete week. For cost, a drop shows green.
- Weekly Performance Breakdown: one row per Google Ads week, newest first. The top row is usually the current week, which isn't finished yet.
| Column group | Columns |
|---|---|
| Store Data | Store Revenue, Sales Orders, Items Sold, Door Traffic |
| Google Ads Data | Campaigns, Clicks, Impressions, Cost, Conversions, CTR, Avg CPC, Conv Rate |
What the store columns count:
- Store Revenue: the money received on sales that week, less refunds, whatever the order's status — the same revenue the Dashboard and the Sales Report read. A deposit taken this week on a delivery next week is this week's revenue.
- Sales Orders and Items Sold: the Sale orders that are Completed, Delivered or Shipped, in the week each became a sale — a quote in the week it was accepted, any other sale in the week it was entered. Quotes, returns, scrap and cancelled orders are left out. Items Sold takes off any units brought back, in the week of the sale. A line under the table says which is which. When the weeks reach back before your store switched to counting revenue as the money received, a second line says so.
- Door Traffic: door traffic from the whole store's Daily Journal entries, with each person's day counted once. Everyone sees the same number.
Ad money — Cost and Avg CPC — is shown in your Google Ads account's own currency, and the Google Ads Data heading names that currency. Store Revenue is your store's own money and is in US dollars, the currency every store works in. Nothing is converted: a figure Google reports as 412.90 euros is shown as 412.90 euros. When Google hasn't reported the account's currency, the heading and the dropdown say Currency unknown and ad money is shown as a plain number, such as 412.90, never as dollars. Click Refresh Accounts to ask Google again.
Performance Comparison
This tab compares Google Ads numbers only. It shows no store revenue, sales orders or door traffic. First choose a Comparison Type:
| Type | You pick | Date range |
|---|---|---|
| Time Periods (default) | Period 1 and Period 2, with the presets This Month, Last Month, Last 7 Days and Last 30 Days, or your own start and end dates | Period 1 starts as this month so far (the 1st to today), Period 2 as the whole of last month |
| Campaigns | Campaign 1 and Campaign 2. The two with the most clicks are picked for you until you pick your own, which stay picked when you switch to another type and back | Always the last 30 days |
| Accounts | Account 1 and Account 2. The first two are picked for you the first time; after that your own two are kept when you switch away and back | Always the last 30 days |
The results load on their own:
- two side-by-side cards with Clicks, Impressions, Cost, Conversions, CTR, CPC and Conv Rate. Cost and CPC are in the ad account's own currency — comparing two accounts, each side keeps its own
- a Performance Changes row with each metric's % change, first item against second (for Cost and CPC, a drop shows green)
- Key Insights, a list of automatic takeaways.
When you switch tabs, the tab you leave goes back to its defaults.
Step by step: review ad performance
- Pick your ad account in the account bar.
- On Weekly Reports, choose a range (Last 30 days or a whole month works best). Read each week's Cost next to its Store Revenue and Sales Orders.
- Check Week-over-Week Trends to see which way last week went.
- Switch to Performance Comparison to compare this month with last month, two campaigns or two ad accounts. Then read Key Insights.
Tips & best practices
- The page doesn't calculate ROAS. For a rough weekly return, divide Store Revenue by Cost yourself. Store Revenue counts all the money that came in on sales, not just on the ones that came from ads, and a sale's revenue can land in a later week than its ad click.
- Use Last 30 days or a whole month to see trends. Last 7 days never covers enough weeks, so the trend always reads "Insufficient data for comparison".
- Log door traffic in the Daily Journal every day so the Door Traffic column fills in. It doesn't matter who logs it: the column counts the whole store's entries.
- Is a new ad account missing from the list? Click Refresh Accounts. The first connection lists up to 10 accounts. Refresh finds all of them.
- The numbers reload on their own when you change the account or the range. Refresh Accounts is for the account list, but the open tab also reloads once the new list arrives.
Troubleshooting
| Issue | Fix |
|---|---|
| Google Ads Account: Not Connected with a Connect Google Ads Account button | The store really isn't connected, or someone disconnected it. Click the button and allow access on Google. A store that is connected but couldn't list its ad accounts keeps the green dot and says "We couldn't load your ad accounts." instead — read the red message beside it for the cause |
| Red "Could not discover Google Ads accounts. Please ensure you have at least one Google Ads account with admin access." | The Google login that was used can't reach an ad account. Connect again with the Google login that has access to it: click Connect Google Ads Account (if the dropdown is still showing, click Disconnect first) |
| "Please select a Google Ads account above to …" | Either the store isn't connected yet (connect it first), or it has several ad accounts and none has been picked in this browser yet. Choose one in the account dropdown |
| Error Loading Weekly Data "Unable to access Google Ads account metrics: …" | Google refused the report for that ad account. Check that the connected Google login can reach it, then try Refresh Accounts or reconnect. If it keeps happening, send support the exact text |
| The trend chip reads "Insufficient data for comparison" and every change is 0.0% | Google returned fewer than three weeks. Pick Last 30 days or a month |
| Door Traffic is 0 | Nobody logged door traffic in the Daily Journal that week. Any team member's entries count |
| Ad cost shows a currency I don't expect | It follows the ad account picked in the account bar, whose currency the dropdown shows after the ID. Pick the right account |
| "Currency unknown", and ad cost has no currency symbol | Google didn't report that ad account's currency, or its details couldn't be read when the list was made. The amounts are as Google gave them, with no symbol rather than a guessed one. Click Refresh Accounts to read the account again |
| The Unlock Pro & Premium Features card and a Demo Data badge | Your store is on Basic, so the page shows sample data and the account controls are greyed out. Click Check Details to see the plans on Plan & Billing |
| "That connection link has expired. Start again from Ads Insights and finish within 10 minutes." after Google | More than 10 minutes passed on Google's screen. Go back to Ads Insights and connect again |
| "403 - Forbidden" | Your store owner has hidden Ads Insights from your menu in Settings → Team. The old Ads Insights & Sales Metrics and Business Insights addresses open Ads Insights, so they show it too. Ask them to show it |
What's next
- Watch rival ads: Growth → Competitors
- Log door traffic every day: Reports → Daily Journal
- Convert ad clicks: Sales → New
- See revenue received: Reports → Sales Report
- Try the page with sample data: Demo mode
Detailed reference
Every button, icon, field and message on this page, for when you need the exact detail. Each panel starts closed. Open the one you need.
Page header and toolbar
| Control | Where | What it does | Notes |
|---|---|---|---|
| Title Google Ads Insights + "Comprehensive analysis and reporting for your Google Ads campaigns with real-time API integration." | Header, left | Static heading | Always shown |
| Demo (Play icon, blue) | Header, right | Opens a copy of this page with sample data. The guided tour starts by itself the first time | Everyone, every plan, connected or not. See the Demo mode panel below and Demo mode |
| Way in: Growth → Ads Insights | Sidebar | Opens this page | A Basic store that isn't on a trial sees a small Pro tag next to it |
| Way in: card Google Ads, reading Connected or Set up | Dashboard, level 07 Intelligent | Opens this page | Connected when the store has an active Google Ads connection |
| Way in: link Ads & Sales | Dashboard, level 07 Intelligent links | Opens this page | — |
| Way in: Ads & Sales Insights / Ads Performance Comparison | Shortcuts, Growth | Open this page on the Weekly Reports / Performance Comparison tab | The tab is only chosen as the page opens. Clicking tabs later doesn't change the page address |
| "Not authenticated" | Whole page | Shown instead of the page | You're not signed in, or your session ran out. Sign in again |
Account bar (the top strip of the page card)
| Control | Where | What it does | Notes |
|---|---|---|---|
| Green dot + Google Ads Account: / red dot + Google Ads Account: Not Connected / grey dot + Google Ads Account: Checking… | Account bar, left | Shows whether the store is connected to Google Ads | Green means connected, whether or not the ad accounts loaded: a connected store whose list failed still keeps its green dot, shows "We couldn't load your ad accounts." and keeps Refresh Accounts and Disconnect. Red means the store really has no connection. Grey Checking… shows for a moment on arrival, before the answer is known, and offers no buttons |
| "Loading accounts..." | Account bar | Placeholder while the account list loads | — |
| "We couldn't load your ad accounts." (amber) | Account bar | Says the connection is fine but the list of ad accounts didn't arrive | Only for a connected store, once loading has finished and no account came back. Refresh Accounts and Disconnect stay available. A red message beside it says why |
| Account dropdown. Each option reads "… • ID: 123-456-7890 • USD" (name, ID, currency), or "… • Currency unknown" when Google gave no currency | Account bar | Picks the ad account both tabs report on. Changing it reloads the open tab | Appears once at least one account has loaded. Greyed out on Basic. Reads "Account …" (the ID) when Google gives no name. The time zone isn't shown. Your pick is remembered in this browser only, and is picked again next visit if it's still in the list |
| Select an account | Dropdown, first option | A blank choice. Both tabs then ask you to pick an account | Only listed when there are 2 or more accounts. With exactly 1 it's picked for you. With several and nothing remembered, nothing is picked at first |
| Refresh Accounts (circular arrows; reads "Refreshing..." and spins) | Account bar, right of the dropdown | Asks Google for every ad account the connection can reach, replaces the list and saves it for the whole store. Keeps your pick if it's still listed, otherwise picks the first account | Greyed out while it runs and on Basic. Once the new list arrives, the open tab reloads its numbers, and a Performance Comparison set to Accounts keeps the two accounts you picked if they are still listed (the first two only when neither is). The first connection names only up to 10 accounts. Refresh finds all of them. Errors show in the red message ("Failed to refresh accounts" or a specific message) and the old list stays |
| Disconnect (broken-link icon; reads "Disconnecting...") | Account bar, far right | Opens Disconnect Google Ads?. On Disconnect it removes the store's Google Ads connection, forgets the picked account in this browser and reloads the page in the Not Connected state | Shown whenever the store is connected, including when no ad account could be loaded — it is the way out of a connection that has gone wrong. Affects everyone in the store, so it asks first; Cancel changes nothing. There's no success message — the page simply comes back Not Connected. Greyed out while it runs and on Basic. Reconnecting picks the same connection back up. If it can't be removed, a red message says why and the connection, the account list and your picked account all stay as they were. If there was nothing to remove, the page says "This store had no Google Ads connection to disconnect." and comes back Not Connected |
| Connect Google Ads Account (plus icon, blue) | Account bar, where the dropdown would be | Takes you to Google, where you sign in and allow access to Google Ads and to your email address and basic profile. You then land on the Google Ads Integration page, which comes back here after about 2 seconds | Shown only when the store has no Google Ads connection and isn't on Basic, so it is never offered to a store that is already connected. Finish on Google within 10 minutes. If it can't start: "Failed to initiate Google Ads authorization", or "Authentication required" when you're signed out |
| Red message | Account bar, right | The latest account-bar error (see Messages you may see) | Hidden on Basic |
| Demo Data (amber badge) | Account bar, right | Marks the numbers as sample data | Basic plan, not on a trial |
| "Account Selected" | Account bar, right | Status text | Shown whenever an account is picked |
Tab bar and footer
| Control | Where | What it does | Notes |
|---|---|---|---|
| Weekly Reports (calendar icon, green) | Tab bar | Opens Weekly Reports | The default tab. Leaving it puts the date range back to Last 30 days, and the data reloads when you come back |
| Performance Comparison (trend icon, orange) | Tab bar | Opens Performance Comparison | Leaving it puts the type, dates and picks back to their defaults |
| "Real-time Analytics" (bar-chart icon) | Footer, left | Static text | Always shown |
| Green dot + "Account: …" | Footer, left | Shows the picked ad account's ID | Only when an account is picked |
| "Google Ads API v24 • GAQL Powered" | Footer, right | Static text | Always shown. v24 is the Google Ads API version every read on this page uses |
Tab: Weekly Reports
Heading Weekly Performance Reports. The tab loads by itself when an account is picked or the date range changes. It has no Apply or Refresh button.
| Control | Where | What it does | Notes |
|---|---|---|---|
| "Please select a Google Ads account above to view weekly reports" | Tab body | Shown instead of the report | No account is picked. This includes a store that isn't connected |
| Date range dropdown: Last 7 days, Last 14 days, Last 30 days, This month, Last month | Tab header, right | Sets the Google Ads reporting window and reloads the whole tab | Default Last 30 days. Goes back to the default when you switch tabs. On Basic you can change it, but the sample numbers stay the same |
| "Loading weekly reports from Google Ads API..." (spinner) | Where the table goes | Shown while the data loads | — |
| Error Loading Weekly Data + reason (warning icon) | Top of the tab | Says why the Google Ads data failed. The cards, trends and table are cleared | See Messages you may see |
| Total Clicks + "CTR: …%" | Summary card 1 | Total clicks in the range. CTR = clicks ÷ impressions | — |
| Total Cost + "Avg CPC: …" | Summary card 2 | Total ad spend and the average cost per click | Both are in the ad account's own currency, the same as the Cost and Avg CPC columns. Never converted |
| Conversions + "Rate: …%" | Summary card 3 | Total conversions. Rate = conversions ÷ clicks | Can show decimals, because Google counts part-conversions |
| Impressions + the range name (for example "Last 30 days") | Summary card 4 | Total impressions | — |
| Week-over-Week Trends + chip "… vs … (two complete weeks)" | Below the cards | Four tiles, Clicks Change, Cost Change, Conversions Change and Impressions Change. Each is the % change from the week before to the last complete week | The current, unfinished week is left out. Green means good. For Cost a drop is green and a rise red. For the other three a rise is green. If fewer than three weeks come back, the chip reads "Insufficient data for comparison" and every tile shows 0.0%. A metric that was 0 in the earlier week shows 0.0%. The chip's dates are the same Mondays the Week column shows |
| Weekly Performance Breakdown + "Data from Google Ads account … • … weeks" | Below the trends | One row per Google Ads week, newest first | The top row is usually the current week, which isn't finished. The first and last weeks can be partial because the range cuts through them. Read-only: no sorting, row clicks or export. Rows only highlight on hover |
| Week | Table | Start date of the Google Ads week, as year-month-day. Google's weeks start on Monday | — |
| Store Data → Store Revenue | Table | The money received on sales that week, less refunds, read from your books: each payment in the week it came in, whatever the order's status | Money on purchase orders is never counted. The week runs from midnight Monday to the end of Sunday in your store's time zone. Always in $. $0.00 when your books cannot be read, so the ad figures still show |
| Sales Orders | Table | The number of Sale orders with the status Completed, Delivered or Shipped that became a sale that week | Quotes, returns, scrap and cancelled orders are left out, so this is not the number of orders you wrote that week — the Order Management page counts those. It is not the orders Store Revenue came from: a payment this week can finish off a sale made last month |
| Items Sold | Table | The total quantity on every line of those same orders, less the units brought back | Counts exactly the orders Sales Orders counts, so a quote's lines are never reported as goods that left the shelf. Units brought back come off the week the sale was made, even when the return is weeks later, as the Sales Report's units sold do; the money handed back comes off Store Revenue in the week it goes back. The line under the table reads "Items Sold adds up every line of those sales, less any units brought back." A sale whose every line came back turns Refunded, so it leaves Sales Orders and Items Sold altogether |
| Door Traffic | Table | Door traffic added up from the whole store's Daily Journal entries for that week, counting each person's day once | Everyone in the store sees the same number. 0 when nobody logged anything that week. A day that one person logged both at close and on Create Entry counts once, the same way the Daily Journal's own charts count it, and entries set aside as duplicates are left out. Two people logging two different days still add up, and so does one manager closing two locations on one day |
| Google Ads Data → Campaigns | Table | The number of enabled or paused campaigns with data that week | Removed campaigns aren't counted |
| Clicks, Impressions, Cost, Conversions, CTR, Avg CPC, Conv Rate | Table | Google Ads figures for that week, inside the chosen range | Cost and Avg CPC are in the ad account's own currency, which the Google Ads Data heading names in brackets. Never converted |
| "No weekly data available" / "Try selecting a different date range or ensure your campaigns have recent activity." | Tab body | Google returned no rows for the range | No error is shown |
Which days the Store Data columns cover: the same Monday-to-Sunday week as the Google Ads columns beside them, starting on the Week date, from midnight to the end of Sunday in your store's time zone (Settings → Business Profile). A store with no time zone set falls back to the one your browser is in.
Tab: Performance Comparison
Heading Performance Comparison with a blue New Feature chip. This tab compares Google Ads numbers only: no store revenue, orders, door traffic, ROAS or ROI. The results load by themselves whenever a setting changes. There is no Compare button.
| Control | Where | What it does | Notes |
|---|---|---|---|
| "Please select a Google Ads account above to compare performance" | Tab body | Shown instead of the tab | No account is picked in the account bar. This applies to every comparison type |
| New Feature | Tab header, right | Label only | Always shown |
| Comparison Type: Time Periods, Campaigns, Accounts | Card Comparison Settings, column 1 | Chooses what is compared. The other two columns change to match | Default Time Periods. Goes back to the default when you leave the tab. Switching clears the previous result — and any failure message about it — at once: nothing is shown until the new type has an answer of its own. When it has nothing to load (for example fewer than two campaigns, or only one ad account) you see "Select campaigns to compare performance" — or the Time Periods or Accounts wording — in place of any numbers |
| Period 1 Date Range presets This Month, Last Month, Last 7 Days, Last 30 Days (blue) | Column 2 (Time Periods) | Fill Period 1's start and end dates and reload | This Month = the 1st of this month to today. Last Month = the whole previous month. Last 7 Days = 7 days ago to today. Last 30 Days = 30 days ago to today. Every preset is whole calendar days in your ad account's own time zone — your store's when the account doesn't name one — so no preset ever ends after today, whatever time of day you use it. An ad account connected a while ago may have no time zone on record, in which case your store's is used; Refresh Accounts asks Google for it again |
| Period 1 start date and end date (date pickers) | Column 2 (Time Periods) | Your own dates for Period 1 | Default: the 1st of this month to today. The dates are checked as you type. An end before its own start reads "Period 1 ends before it starts. Check its dates.", a date later than today reads "Dates in the future have no ad data yet. Pick dates up to today.", and a cleared date reads "Fill in a start date and an end date for both periods." While one of those lines shows, nothing is asked of Google and no numbers are shown |
| Period 2 Date Range: the same four presets (green) + start and end dates | Column 3 (Time Periods) | Same as Period 1, for Period 2 | Default: last month |
| Campaign 1 ("Select campaign"; "Loading campaigns..." while loading) | Column 2 (Campaigns) | Picks the first campaign | Lists enabled and paused campaigns with data in the last 30 days, most clicks first. The top two are picked for you when there are at least two and neither of your own picks is on the list; once you pick, your choice stays when you switch Comparison Type and back. If the list can't load, a red line under the settings names the cause and offers Try again; an empty list with no line beside it simply means the account has fewer than two campaigns. Always uses the last 30 days. There are no date inputs |
| Campaign 2 | Column 3 (Campaigns) | Picks the second campaign | Nothing loads until both are picked. A campaign with no clicks or impressions in the last 30 days — a paused one, usually — shows zeros beside the other campaign, so you keep the numbers you came for. Switching to another ad account compares nothing until that account’s own campaign list has arrived, and a pick the new account does not offer is dropped when it does — so a campaign the account has never heard of is never compared and never shown as all zeros. If that list can’t load, nothing is compared at all and the red line under the settings says why |
| Account 1 ("Select account"; each option "name (ID)") | Column 2 (Accounts) | Picks the first ad account | Lists the same accounts as the account bar. The first two are picked for you when the store has two or more, until you pick your own; switching to another comparison and back keeps yours. Always uses the last 30 days |
| Account 2 | Column 3 (Accounts) | Picks the second ad account | Nothing loads until both are picked. With only one ad account, Account 2 starts empty and the only choice is that same account again |
| Helper text | Below the settings | Time Periods: "Comparing metrics (clicks, impressions, cost, conversions, CTR, CPC, conversion rate) across different time periods to identify trends and performance changes." Campaigns: "Comparing performance metrics between two individual campaigns over the last 30 days. This shows head-to-head performance including clicks, impressions, cost, conversions, CTR, CPC, and conversion rate to identify which campaign is performing better and by how much." Accounts: "Comparing overall account performance metrics across different Google Ads accounts to evaluate relative performance." | Text only |
| "Loading comparison data from Google Ads API..." (spinner) | Tab body | Shown while the data loads | — |
| Error Loading Comparison Data + reason (warning icon) | Tab body | Says why the comparison failed | Belongs to the settings it was asked of: change the Comparison Type, a date or a pick and the message goes with the numbers, so a failure never sits under a different question. See Messages you may see |
| Two result cards (blue = first, green = second) | Below the settings | Each lists Clicks, Impressions, Cost, Conversions, CTR, CPC and Conv Rate | Card title: the dates ("… to …"), the campaign name or the account name. Cost and CPC are in the ad account's own currency; comparing two accounts, each card keeps its own and nothing is converted |
| Performance Changes (… vs …): tiles Clicks, Impressions, Cost, Conversions, CTR, CPC, Conv Rate | Below the cards | The % change of the first item against the second: (first − second) ÷ second | The second item is the baseline. Green = better, red = worse. For Cost and CPC a drop is green. If the second item is 0 and the first is above 0, the tile shows +100.0% |
| Key Insights | Bottom | Automatic one-line takeaways (rules below) | When no rule applies: "Performance Analysis" / "Compare different time periods to identify trends and optimization opportunities." |
| Source line | Bottom of Key Insights | Time Periods: "Data from Google Ads account … • Real-time API data". Campaigns: "Campaign data from Google Ads account … • Real-time API data". Accounts: "Multi-account comparison • Real-time Google Ads API data" | On Basic, behind the plan lock, each ends "• Sample data" instead, because the numbers there are samples |
| Empty state | Tab body | Time Periods: "Select time periods to compare performance" / "Choose different date ranges to analyze performance changes over time." Campaigns: "Select campaigns to compare performance" / "Choose different campaigns to analyze performance differences." Accounts: "Select accounts to compare performance" / "Choose different Google Ads accounts to compare their performance." | Shown when picks or dates are missing, including straight after switching Comparison Type, and when the last failure was about a different set of settings. It is not shown while a campaign-list failure or a date line is on screen: those say what is wrong instead |
Key Insights rules (each compares the first item against the second):
| Insight | Colour | Shows when | Text |
|---|---|---|---|
| Significant CTR Improvement | Green | CTR up more than 10% | "CTR increased by …%, indicating better ad relevance and targeting" |
| CTR Decline | Red | CTR down more than 10% | "CTR decreased by …%, consider reviewing ad copy and targeting" |
| Improved Cost Efficiency | Green | Average CPC down more than 15% | "Average CPC decreased by …%, showing better bid optimization" |
| Rising Costs | Yellow | Average CPC up more than 20% | "Average CPC increased by …%, monitor keyword competition" |
| Strong Conversion Growth | Green | Conversions up more than 15% | "Conversions increased by …%, excellent campaign performance" |
| Optimal Efficiency | Green | Cost went down and conversions went up | "Reduced spend while increasing conversions - excellent optimization" |
Dialog: Unlock Pro & Premium Features
A card that floats in the middle of the screen when the store is on Basic and not on a free trial. It isn't a pop-up window. You can't close it. The page behind it stays visible under a light wash, and you can still click the page's controls.
| Control | Where | What it does | Notes |
|---|---|---|---|
| Lock icon + Unlock Pro & Premium Features + "SMS, insights, finance tools & more" | Card header (violet) | Text | — |
| Check Details (green) | Card header, right | Opens Plan & Billing | The card header's only button |
| Pro list: "500 SMS/month + a dedicated phone #", "SMS campaigns & review invites", "Ads-vs-store insights", "Finance: expenses, assets, reports", "Customer Portal: tracking, payments, scheduling" | Card body, left | Text | — |
| Premium list: "Everything in Pro", "2,000 SMS/month", "Advanced reporting (grouped/pivot)", "CSV / PDF data export", "Workforce: time clock, timesheets, pay runs" | Card body, right | Text | — |
What else changes on Basic:
- The page shows sample data, not your Google Ads data. The account list is two sample accounts, "Main Store - Google Ads • ID: 123-456-7890 • USD" and "E-commerce Campaigns • ID: 234-567-8901 • USD", even if the store connected a real account.
- The account dropdown, Refresh Accounts and Disconnect are greyed out. Connect Google Ads Account never appears and the red message is hidden. The amber Demo Data badge shows.
- Weekly Reports shows 8 sample weeks labelled like "Sep 13 - Sep 19", oldest first, with numbers that change on every page load. The trend chip reads "Compared to previous period".
- The Weekly date range and every Comparison control still respond, but the numbers never change. With Campaigns chosen, the campaign options have blank names.
- A store on its free trial gets full access. If a store chooses Basic during the trial, the Basic view applies at once. While the plan isn't known yet, the page gives full access.
Sub-page: Google Ads Integration (after Google sign-in)
Google sends you here after you allow access on its screen.
| Control | Where | What it does | Notes |
|---|---|---|---|
| Title Google Ads Integration | Card | Heading | Always shown |
| Spinner + "Processing Google Ads integration..." | Card | Brief first state | On arrival |
| Green check + "Google Ads account connected successfully!" + "Redirecting to Ads Insights..." | Card | Goes back to Ads Insights after 2 seconds | The address then ends in "?refresh=true". That's harmless |
| Red cross + message | Card | Says why the connection failed (see Messages you may see) | Shown after Google, when saving the connection failed |
| "Invalid callback. Please try connecting again." | Card | Shown when the page opens without a result | For example when it's reloaded or opened from a bookmark |
| Return to Ads Insights (blue, full width) | Card, error state | Opens Ads Insights | Error state only |
| Try Again (grey, full width) | Card, error state | Starts the Google sign-in again | Error state only. If it can't start, the card reads "Failed to initiate Google Ads authorization" |
When the return from Google itself is wrong. You still land on this page, with one of these sentences and the two buttons:
| Message | When | What to do |
|---|---|---|
| "You cancelled the Google sign-in, so nothing was connected. You can connect again whenever you like." | You clicked Cancel or refused access on Google's screen | Nothing was changed. Click Try Again when you're ready |
| "Google could not complete the sign-in. Please try connecting again." | Google itself refused the sign-in for some other reason | Click Try Again |
| "Google did not finish the sign-in. Please try connecting again from Ads Insights." | Google sent you back without a result | Start again from Ads Insights |
| "That connection link has expired. Start again from Ads Insights and finish within 10 minutes." | More than 10 minutes passed between clicking Connect and finishing on Google | Connect again and finish within 10 minutes |
| "That connection link is not valid any more. Start again from Ads Insights." | The link was changed, reused or broken | Connect again from the Ads Insights page |
| "We could not tell which store to connect. Reload Ads Insights and try again." | Your login isn't tied to a store | Finish store setup, or contact support |
| "Google did not give lasting access to your ad account. Connect again and allow every permission it asks for." | Google gave no refresh token, usually because a permission was left unticked | Click Try Again and allow everything Google asks for |
| "We could not finish connecting to Google Ads. Please try again, and contact support if it keeps happening." | Anything else went wrong while the connection was being saved | Click Try Again. The detail is kept in UpChannels' own logs, so support can look it up |
Old addresses: Ads Insights & Sales Metrics and Business Insights
Two older addresses open Ads Insights, so a bookmark or a typed address lands on the real numbers:
/ads-insights/metrics(the old Ads Insights & Sales Metrics page)./insights(the old Business Insights page).
Ads Insights then applies its own rules: on Basic you see the plan lock, and someone the Ads Insights menu item is hidden from sees "403 - Forbidden".
Messages you may see
| Message | When it appears | What to do |
|---|---|---|
| "Google Ads Account: Not Connected" | Account bar: the store has no Google Ads connection — never connected, or disconnected | Click Connect Google Ads Account |
| "Google Ads Account: Checking…" (grey dot) | Account bar, for a moment while the page works out whether the store is connected | Wait. No buttons are offered until the answer is known |
| "We couldn't load your ad accounts." | Account bar: the store is connected but no ad account came back | Click Refresh Accounts. If the red message beside it names a Google problem, follow that. Disconnect stays available if you need to connect again from scratch |
| "Loading accounts..." | Account bar, while the list loads | Wait |
| "Failed to fetch accounts" | Account bar: the account list failed with no specific reason | Reload the page. If it happens again, click Connect Google Ads Account to connect again |
| "Failed to connect to server" | Account bar: a network error while loading the accounts | Check your internet connection and reload |
| "Failed to refresh accounts" | Refresh Accounts failed | Try again. If it keeps failing, reconnect |
| "Failed to disconnect account" / "Failed to disconnect Google Ads account" | Disconnect couldn't be completed, because of a network problem or a refusal from the server | Try again. The store is still connected, so nothing has changed |
| "This store had no Google Ads connection to disconnect." | Disconnect, when the store was already disconnected (for example a colleague did it first) | Information only. The page comes back Not Connected |
| "Failed to initiate Google Ads authorization" | Connect Google Ads Account or Try Again couldn't start the Google sign-in | Try again. If it keeps happening, contact support |
| "Authentication required" | You clicked Connect after your session ran out | Sign in again, then connect |
| "Unauthorized" | Account bar or an error panel, after your session ran out while the page was open | Sign in again |
| "Your account is not linked to an organization, so Google Ads cannot be loaded." | Account bar: your login has no store | Finish store setup, or contact support |
| "Google Ads account not connected. Please authorize your Google Ads account first." | Account bar or a report: the store has no active connection, or its Google permission is missing | Click Connect Google Ads Account |
| "Google Ads is not fully configured on the server (missing developer token). Please contact support." | Account bar: a setup problem on the UpChannels side | Contact UpChannels support. The store can't fix this |
| "Could not discover Google Ads accounts. Please ensure you have at least one Google Ads account with admin access." | Account bar: Google returned no ad account for that Google login | Connect again with the Google login that has access to the ad account: click Connect Google Ads Account, or Disconnect first if the dropdown is still showing |
| "No accessible Google Ads accounts found. Please re-authorize your connection." | Account bar: no accounts were found | Same as above: connect again with the right Google login |
| "Failed to fetch Google Ads accounts" | Account bar: an unexpected error | Try again later. Contact support if it persists |
| "Please select a Google Ads account above to view weekly reports" | Weekly Reports, no account picked | Pick an account in the account bar |
| "Please select a Google Ads account above to compare performance" | Performance Comparison, no account picked | Pick an account in the account bar |
| "Loading weekly reports from Google Ads API..." | Weekly Reports, loading | Wait |
| Error Loading Weekly Data + "Unable to access Google Ads account metrics: …" | Google refused the report (for example a permission problem with that ad account) | Check the connected Google login can reach that ad account. Try Refresh Accounts or reconnect. Send support the exact Google text if it persists |
| Error Loading Weekly Data + "Failed to fetch Google Ads metrics" / "Failed to fetch weekly data" | An unexpected error | Try again. Contact support if it persists |
| "No weekly data available" / "Try selecting a different date range or ensure your campaigns have recent activity." | Google returned no rows for the range | Pick a longer range, and check your campaigns ran in that period |
| "Insufficient data for comparison" | Trends chip, when fewer than three weeks came back | Choose Last 30 days or a month |
| "… vs … (two complete weeks)" | Trends chip, normal | Information only |
| "Loading comparison data from Google Ads API..." | Performance Comparison, loading | Wait |
| Error Loading Comparison Data + "Unable to access Google Ads account metrics: …" | Google refused one of the requests (for example Account 2 isn't reachable) | Same as for Weekly Reports |
| Error Loading Comparison Data + "Failed to fetch Google Ads metrics" / "Failed to fetch … data" / "Failed to fetch campaign data" / "Failed to fetch account data" | Loading failed | Try again. Contact support if it persists |
| "Select campaigns to compare performance" with empty Campaign 1 and Campaign 2 lists | The ad account has fewer than two campaigns with data in the last 30 days. A list that failed to load says so on its own line instead | Run or add campaigns in that account, or pick another account. No numbers are shown meanwhile |
| "Couldn't load campaigns — …" + Try again | Performance Comparison, Campaigns: the campaign list could not be loaded. The line always names a cause, so an empty list next to no line means something else | Click Try again. If it keeps failing, open Weekly Reports for the same account to see the error, or reconnect Google Ads |
| "Campaign data not available. Please ensure the selected campaigns have data for the current period." | Performance Comparison, Campaigns: a safety net, so it should not normally appear. A campaign with nothing to report simply shows zeros | Reload the page and pick the two campaigns again. If it keeps happening, tell support |
| "Fill in a start date and an end date for both periods." / "Period 1 ends before it starts. Check its dates." / "Period 2 ends before it starts. Check its dates." / "Dates in the future have no ad data yet. Pick dates up to today." | Performance Comparison, Time Periods: the dates as they stand can't be reported on | Correct the dates. The comparison loads by itself as soon as they make sense |
| "Select time periods to compare performance" / "Select campaigns to compare performance" / "Select accounts to compare performance" (+ a second line) | Performance Comparison has nothing to show for what is picked — including straight after switching Comparison Type, so the previous type's numbers are never left on screen | Finish your picks |
| "Performance Analysis" / "Compare different time periods to identify trends and optimization opportunities." | Key Insights, when no rule applies | Information only |
| Significant CTR Improvement, CTR Decline, Improved Cost Efficiency, Rising Costs, Strong Conversion Growth, Optimal Efficiency | Key Insights (rules in the Performance Comparison panel) | Information only |
| New Feature | Performance Comparison header | Information only |
| Demo Data | Account bar, Basic plan | This is sample data. Upgrade to Pro to see your own |
| Unlock Pro & Premium Features / "SMS, insights, finance tools & more" | Floating card, Basic plan | Click Check Details to open Plan & Billing |
| "Processing Google Ads integration..." | Google Ads Integration page, on arrival | Wait |
| "Google Ads account connected successfully!" / "Redirecting to Ads Insights..." | Google Ads Integration page, success | Wait about 2 seconds for the page to go back to Ads Insights |
| "Failed to connect Google Ads account" | Google Ads Integration page, failure with no specific reason | Click Try Again |
| "Google did not give lasting access to your ad account. Connect again and allow every permission it asks for." | Google Ads Integration page: Google didn't give lasting access | Click Try Again and allow every permission Google asks for |
| "That Google Ads account (123-456-7890) is already connected to another UpChannels store. Disconnect it there first, or choose a different account when Google asks." | Google Ads Integration page: the Google Ads account you chose is connected to a different UpChannels store. One ad account belongs to one store, so its access can only live in one place | Disconnect it on the other store, or click Try Again and choose a different account on the Google screen. The other store is never named |
| "We could not finish connecting to Google Ads. Please try again, and contact support if it keeps happening." | Google Ads Integration page: the connection could not be saved for any other reason | Click Try Again. If it repeats, tell support roughly when you tried — the technical detail is in UpChannels' own logs, so you do not need to copy anything down |
| "Invalid callback. Please try connecting again." | Google Ads Integration page opened without a result | Click Try Again or Return to Ads Insights |
| "You cancelled the Google sign-in, so nothing was connected. You can connect again whenever you like." and the other return-from-Google sentences | The return from Google was cancelled, expired or broken. You always land on the Google Ads Integration page | See the Google Ads Integration panel |
| No message after Disconnect | The disconnect worked. There's no success message | The page reloads showing Not Connected. To undo, click Connect Google Ads Account |
| Disconnect Google Ads? "This removes the Google Ads connection for everyone in your store, so no one sees ad clicks, cost or conversions until it is connected again. Nothing in Google Ads itself changes, and you can reconnect at any time with a Google login that can reach the account." | You clicked Disconnect | Disconnect to go ahead, Cancel to leave the connection alone |
| "Not authenticated" | The page opened without a signed-in session | Sign in |
| "403 - Forbidden" / "You do not have permission to view this page. Contact your organization owner." | Your owner hid Ads Insights from your menu, in a store with more than one active person. It shows however you reach the page — a link elsewhere in the app, a bookmark or a typed address — and the sidebar row goes, along with both Shortcuts cards, Ads & Sales Insights and Ads Performance Comparison | Ask your owner to show it again in Settings → Team |
| "Demo mode — ads insights are populated with sample data. All actions are disabled." | Demo banner | Information only. Exit Demo Mode takes you to the live page |
Who can use what
| Topic | Rule |
|---|---|
| Plan | Your real data needs Pro or Premium, or an active free trial. On Basic (not on a trial) the page shows sample data and the upgrade card. A store that chooses Basic during its trial gets the Basic view at once. While the plan isn't known yet, the page gives full access. See Plan & Billing |
| Menu tag | A Basic store sees a small Pro tag next to Ads Insights in the sidebar. There's no tag during a trial |
| Roles | There's no owner or manager check. Any signed-in team member can open the page, connect, refresh the accounts and disconnect. Disconnect asks for confirmation first, because it affects the whole store |
| Menu visibility | An owner can hide Ads Insights for one person in Settings → Team. That person then gets "403 - Forbidden" however they reach the page — a link elsewhere in the app, a bookmark or a typed address — and the sidebar row and the matching Ads & Sales Insights and Ads Performance Comparison cards on Shortcuts are gone. The two old addresses that open Ads Insights (Ads Insights & Sales Metrics and Business Insights) end on the same 403; the demo page is exempt and still opens. A store with only one active person is never blocked; someone switched off or removed in Team doesn't count as that person |
| Connection | One Google Ads connection per store, shared by every user. It uses the Google login of whoever connected it. Everyone in the store sees the same account list |
| One store per ad account | Two UpChannels stores can't be connected through the same Google Ads account at once. If another store is already connected with the same Google login's ad accounts, connecting fails with an error on the Google Ads Integration page. Once that store disconnects, the account is free again |
| Picked account | Remembered per browser, not per store, so each person and device may need to pick it once |
| Door Traffic | Shared: the whole store's Daily Journal entries count, whoever wrote them, with each person's day counted once |
| Demo | Open to everyone, on every plan. The demo page is exempt from menu visibility, so hiding Ads Insights closes this page but not its demo |
Demo mode (/ads-insights/demo)
- Open it: click Demo (Play icon) at the top right of the page header.
- Header: Google Ads Insights — Demo + "Sample ads insights populated with demo data. All actions are disabled."
- Banner: "Demo mode — ads insights are populated with sample data. All actions are disabled." with a Take a Tour button (question-mark icon) that restarts the tour at step 1.
- Tour: starts by itself the first time the demo opens. It has 10 steps, and each step switches to its tab first.
- Disabled: the whole account bar (account dropdown, Refresh Accounts, Disconnect), the Weekly date range, Comparison Type, all eight preset buttons and all four date inputs.
- Still works: the Weekly Reports and Performance Comparison tabs, Take a Tour, the tour controls and Exit Demo Mode.
- Leave: Exit Demo Mode (left arrow, header right) opens the live Ads Insights page.
| # | Tab | Tour step | What it points at |
|---|---|---|---|
| 1 | Weekly Reports | Account Selection: "Select which Google Ads account to view. You can switch between multiple connected accounts, refresh the account list, or disconnect." | The account bar |
| 2 | Weekly Reports | Report Tabs: "Switch between Weekly Reports (store revenue vs ads) and Performance Comparison (period-over-period ads analysis). This tour walks through both." | The tab bar |
| 3 | Weekly Reports | Summary Cards: "At-a-glance metrics showing total clicks, cost, conversions, and impressions across the selected date range." | The four summary cards |
| 4 | Weekly Reports | Week-over-Week Trends: "See how your key metrics changed compared to the previous week — clicks, cost, conversions, and impressions trends at a glance." | The trends panel |
| 5 | Weekly Reports | Weekly Performance Table: "Detailed breakdown combining Store Data (Store Revenue is the money received that week, less refunds; Sales Orders and Items Sold count completed, delivered or shipped sales only; Door Traffic comes from the Daily Journal) with Google Ads Data (campaigns, clicks, impressions, cost, conversions, CTR, CPC, conversion rate) in the ad account's own currency." | The weekly table |
| 6 | Weekly Reports | API Info: "Shows your connected account ID and confirms data is powered by the Google Ads API v24 with GAQL queries." | The footer strip |
| 7 | Performance Comparison | Comparison Settings: "Choose what to compare — time periods, campaigns, or accounts — and set the two date ranges. Quick presets like This Month or Last 7 Days fill the dates instantly." | The Comparison Settings card |
| 8 | Performance Comparison | Side-by-Side Periods: "Period 1 and Period 2 are laid out side by side with clicks, impressions, cost, conversions, CTR, CPC, and conversion rate for each range." | The two result cards |
| 9 | Performance Comparison | Performance Changes: "Percentage change for every metric between the two periods, color-coded green or red — cost and CPC invert so a drop reads as an improvement." | The Performance Changes card |
| 10 | Performance Comparison | Key Insights: "Automatically surfaced takeaways — CTR improvements, cost efficiency, and conversion growth — to highlight what changed and why it matters." | The Key Insights card |
Tour controls:
| Control | Where | What it does | Notes |
|---|---|---|---|
| Progress dots + "… of 10" | Tour box, top and bottom left | Shows which step you're on | — |
| Back | Tour box footer | Previous step | Hidden on step 1 |
| Skip | Tour box footer | Closes the tour | — |
| Next (right arrow) / Got it! | Tour box footer | Next step. On the last step, Got it! closes the tour | — |
| Click the dark background | Outside the tour box | Closes the tour | — |
| Keys: Esc closes. → or Enter goes to the next step (closes on the last). ← goes back | Anywhere while the tour is open | Moves through the tour | — |
| Automatic skip | — | If a step's target doesn't appear within about 3 seconds, the tour moves to the next step | — |
| Take a Tour | Demo banner | Restarts the tour at step 1 | Closing the tour always resets it to step 1 |
Differences from the live page:
- It always shows the amber Demo Data badge and "Account Selected". There's no upgrade card, no Connect Google Ads Account, no red message and no loading, empty or error states. The account dropdown has no "Select an account" option.
- The sample accounts are "Main Store - Google Ads • ID: 123-456-7890 • USD" (picked) and "E-commerce Campaigns • ID: 234-567-8901 • USD".
- Weekly Reports: 8 sample weeks labelled like "Sep 13 - Sep 19", oldest first. The live page shows year-month-day start dates, newest first. The numbers are random on every load. The Impressions card always reads "Last 30 days". The trends chip reads "Compared to previous period", with fixed changes: clicks +8.5%, cost −3.2%, conversions +12.4%, impressions +5.7%.
- Performance Comparison: only the Time Periods layout (this month against last month), with fixed sample figures such as Clicks 5,840 against 5,120 and Cost $3,420.00 against $3,180.00. Changes: clicks +14.1%, cost +7.5% (red), conversions +20.0%, CPC −4.8% (green). Key Insights shows only Strong Conversion Growth ("Conversions increased by 20.0%, excellent campaign performance"). The source line reads "Data from Google Ads account 123-456-7890 • Sample data".
- The footer is the same as the live page, with "Account: 123-456-7890".
Common questions
Where is ROAS or ROI on this page? It isn't there. The page doesn't calculate ROAS or ROI. Weekly Reports puts each week's Store Revenue next to its ad Cost, so you can divide one by the other yourself. Store Revenue includes all the money that came in on sales, not only on sales that came from ads.
Why doesn't Store Revenue move with Sales Orders? Store Revenue is the money received that week; Sales Orders and Items Sold count the sales completed, delivered or shipped that week. A deposit this week on a delivery next week is this week's revenue and next week's sale. A return splits the same way: its units come off Items Sold in the week of the sale, and its refund comes off Store Revenue in the week the money goes back. A sale made before your store switched to counting revenue this way is not counted again when its last payment comes in.
Why is Door Traffic 0? Nobody in the store logged door traffic in the Daily Journal that week. The column adds up the whole store's entries, whoever wrote them, so you and your colleagues see the same number.
I clicked Disconnect by mistake. How do I undo it? Disconnect asks Disconnect Google Ads? first, so Cancel stops it. If you already confirmed, click Connect Google Ads Account and allow access on Google again. The store's connection is picked back up, and you may need to pick your ad account in the dropdown again.
My new Google Ads account isn't in the dropdown. What do I do? Click Refresh Accounts. It asks Google for every ad account the connected Google login can reach and saves the list for the whole store. The first connection only lists up to 10 accounts. If the account still doesn't appear, the Google login used to connect can't reach it. Disconnect and connect again with a login that can.
Why does the page show sample data and a Demo Data badge? Your store is on the Basic plan. Ads Insights needs Pro or Premium, or a free trial. On Basic the page shows two sample accounts and sample numbers, and greys out the account controls. Click Check Details on the card to see the plans.
Which currency is ad cost in? The ad account's own, as Google reports it — the Google Ads Data heading names it in brackets, and the account dropdown shows it after the ID. Nothing is converted. When Google hasn't reported it, both say Currency unknown, ad money is shown as a plain number with no symbol, and on Performance Comparison Cost and CPC read "(currency unknown)". Store Revenue is separate: it is your store's own money and is in US dollars, the currency every store works in. Comparing two ad accounts that bill in different currencies, each side keeps its own and the Cost change tile says the two are not comparable. It says so too when Google hasn't reported the currency of one account or both (for example "USD vs Currency unknown — not comparable"), since the two may bill in different ones.
Which days does one row cover? Google's weeks run Monday to Sunday, and the Week column shows that Monday. The Store Data columns cover exactly the same seven days, from midnight Monday to the end of Sunday in your store's time zone, so both halves of a row are about the same week. The newest row is usually the current week, which isn't finished yet.